TCF Bank 2005 Annual Report Download - page 85
Download and view the complete annual report
Please find page 85 of the 2005 TCF Bank annual report below. You can navigate through the pages in the report by either clicking on the pages listed below, or by using the keyword search tool below to find specific information within the annual report.-
 1
1 -
2
-
3
-
4
-
5
-
6
-
7
-
8
-
9
-
10
-
11
-
12
-
13
-
14
-
15
-
16
-
17
-
18
-
19
-
20
-
21
-
22
-
23
-
24
-
25
-
26
-
27
-
28
-
29
-
30
-
31
-
32
-
33
-
34
-
35
-
36
-
37
-
38
-
39
-
40
-
41
-
42
-
43
-
44
-
45
-
46
-
47
-
48
-
49
-
50
-
51
-
52
-
53
-
54
-
55
-
56
-
57
-
58
-
59
-
60
-
61
-
62
-
63
-
64
-
65
-
66
-
67
-
68
-
69
-
70
-
71
-
72
-
73
-
74
-
 75
75 -
 76
76 -
 77
77 -
 78
78 -
 79
79 -
 80
80 -
 81
81 -
 82
82 -
 83
83 -
 84
84 -
 85
85 -
 86
86 -
 87
87 -
 88
88 -
 89
89 -
 90
90 -
 91
91 -
 92
92 -
 93
93 -
 94
94 -
 95
95 -
96
-
97
-
98
-
99
-
100
-
101
-
102
-
103
-
104
-
105
-
106
 |
 |

652005 Form 10-K
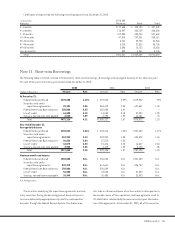
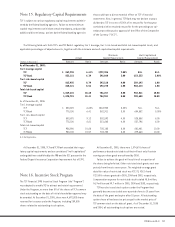
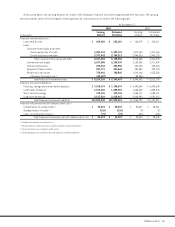
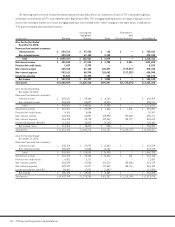
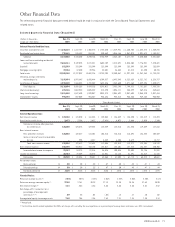
As discussed above, the carrying amounts of certain of the Company’s financial instruments approximate their fair value. The carrying
amounts and fair values of the Company’s remaining financial instruments are set forth in the following table:
At December 31,
2005 2004
Carrying Estimated Carrying Estimated
(In thousands) Amount Fair Value Amount Fair Value
Financial instrument assets:
Loans held for sale $ 229,820 $ 233,192 $ 154,279 $ 155,611
Loans:
Consumer home equity and other:
Home equity lines of credit 1,389,741 1,389,741 1,472,165 1,472,165
Closed-end loans and other 3,797,843 3,749,317 2,946,423 2,943,175
Total consumer home equity and other 5,187,584 5,139,058 4,418,588 4,415,340
Commercial real estate 2,297,500 2,296,035 2,154,396 2,171,409
Commercial business 435,233 432,955 424,135 424,354
Equipment finance loans 387,171 381,668 334,352 332,734
Residential real estate 770,441 760,545 1,014,166 1,022,328
Allowance for loan losses(1) (48,429) – (58,966) –
Total financial instrument assets $ 9,259,320 $ 9,243,453 $ 8,440,950 $ 8,521,776
Financial instrument liabilities:
Checking, savings and money market deposits $ 7,195,074 $ 7,195,074 $ 6,493,545 $ 6,493,545
Certificates of deposit 1,915,620 1,899,994 1,468,650 1,459,943
Short-term borrowings 472,126 472,126 1,056,111 1,056,111
Long-term borrowings 2,511,010 2,525,867 2,048,492 2,091,412
Total financial instrument liabilities $12,093,830 $12,093,061 $11,066,798 $11,101,011
Financial instruments with off-balance sheet risk:(2)
Commitments to extend credit (3) $ 33,274 $ 33,274 $ 28,551 $ 28,551
Standby letters of credit (4) (126) (126) (8) (8)
Loans serviced with recourse (4) (75) (75) (100) (100)
Total financial instruments with off-balance sheet risk $ 33,073 $ 33,073 $ 28,443 $ 28,443
(1) Excludes the allowance for lease losses.
(2) Positive amounts represent assets, negative amounts represent liabilities.
(3) Carrying amounts are included in other assets.
(4) Carrying amounts are included in accrued expenses and other liabilities.