TCF Bank 2005 Annual Report Download - page 45
Download and view the complete annual report
Please find page 45 of the 2005 TCF Bank annual report below. You can navigate through the pages in the report by either clicking on the pages listed below, or by using the keyword search tool below to find specific information within the annual report.-
 1
1 -
2
-
3
-
4
-
5
-
6
-
7
-
8
-
9
-
10
-
11
-
12
-
13
-
14
-
15
-
16
-
17
-
18
-
19
-
20
-
21
-
22
-
23
-
24
-
25
-
26
-
27
-
28
-
29
-
30
-
31
-
32
-
33
-
34
-
 35
35 -
 36
36 -
 37
37 -
 38
38 -
 39
39 -
 40
40 -
 41
41 -
 42
42 -
 43
43 -
 44
44 -
 45
45 -
 46
46 -
 47
47 -
 48
48 -
 49
49 -
 50
50 -
 51
51 -
 52
52 -
 53
53 -
 54
54 -
 55
55 -
56
-
57
-
58
-
59
-
60
-
61
-
62
-
63
-
64
-
65
-
66
-
67
-
68
-
69
-
70
-
71
-
72
-
73
-
74
-
75
-
76
-
77
-
78
-
79
-
80
-
81
-
82
-
83
-
84
-
85
-
86
-
87
-
88
-
89
-
90
-
91
-
92
-
93
-
94
-
95
-
96
-
97
-
98
-
99
-
100
-
101
-
102
-
103
-
104
-
105
-
106
 |
 |

252005 Form 10-K
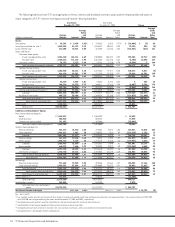
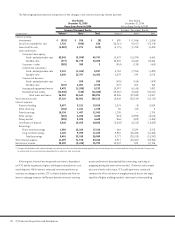
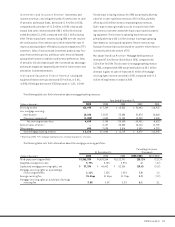
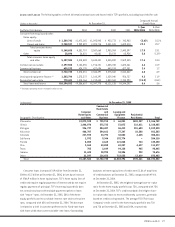
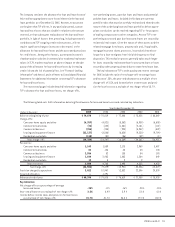
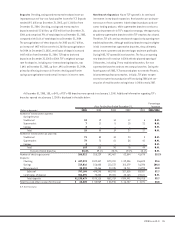
Non-Interest Expense Non-interest expense increased $23.9 million, or 4.1%, in 2005, and $26.8 million, or 4.8%, in 2004, and $20.8
million, or 3.9%, in 2003, compared with the respective prior year. The following table presents the components of non-interest expense:
Compound Annual
Year Ended December 31, Growth Rate
1-Year 5-Year
(Dollars in thousands) 2005 2004 2003 2002 2001 2005/2004 2005/2000
Compensation $274,523 $273,083 $256,447 $254,341 $234,029 .5% 5.6%
Employee benefits and payroll taxes 52,003 49,741 46,357 39,954 32,789 4.5 12.0
Total compensation and
employee benefits 326,526 322,824 302,804 294,295 266,818 1.1 6.4
Occupancy and equipment 103,900 95,617 88,423 83,131 78,774 8.7 6.8
Advertising and promotions 25,691 26,353 25,536 21,894 20,909 (2.5) 6.0
Deposit account losses 20,473 22,369 18,820 19,206 19,236 (8.5) .9
Other 133,998 119,516 124,526 120,762 108,482 12.1 6.7
Subtotal 610,588 586,679 560,109 539,288 494,219 4.1 6.3
Amortization of goodwill –– – – 7,777 –N.M.
Total non-interest expense $610,588 $586,679 $560,109 $539,288 $501,996 4.1 6.0
N.M. Not Meaningful.
Compensation and Employee Benefits Compensation and
employee benefits, representing 53%, 55% and 54% of total non-
interest expense in 2005, 2004 and 2003, respectively, increased
$3.7 million, or 1.1%, in 2005, $20 million, or 6.6%, in 2004
and $8.5 million, or 2.9%, in 2003. The $1.4 million increase in
compensation expense from 2004 was primarily due to continued
new branch expansion, partially offset by decreases in mortgage
banking and commissions and incentives. The 2004 increase in
compensation expense of $16.6 million was driven by a $9.5 mil-
lion increase in retail banking operations driven by TCF’s contin-
ued new branch expansion, a $6.7 million increase in incentive
compensation resulting from improved performance in 2004 and
a $2.1 million increase related to the 2004 acquisition of VGM
Financial Services, partially offset by a $2.9 million decrease
in stock compensation expense. Employee benefits and payroll
expense totaled $52 million in 2005, up $2.3 million from 2004,
primarily due to an increase of $1.9 million in retirement benefits
expense and an increase of $1.5 million in payroll taxes, partially
offset by a $1.8 million decrease in healthcare plan expenses.
In 2004, employee benefits and payroll expense increased $3.4
million primarily due to an increase in retirement expense of $1.4
million and an increase in payroll taxes of $2.2 million. Employee
benefits and payroll expense increased $6.4 million in 2003, pri-
marily due to a $3.1 million increase in retirement expense, a $1.3
million increase in medical expenses and a $1.3 million increase
in payroll taxes. See Note 17 of Notes to Consolidated Financial
Statements for further information on postretirement plans.
Occupancy and Equipment Occupancy and equipment
expenses increased $8.3 million in 2005, $7.2 million in 2004 and
$5.3 million in 2003. The increases were primarily due to TCF’s
new branch expansion and retail banking and leasing activities.
Advertising and Promotions Advertising and promotions
expense decreased $662 thousand in 2005 following increases of
$817 thousand and $3.6 million in 2004 and 2003, respectively.
The decrease in 2005 was primarily due to a $3.7 million decrease
in marketing and promotions, partially offset by an increase of
$2.1 million in loyalty program expenses. The increases in 2004 and
2003 were attributable to additional advertising and promotions
expenses focused on the acquisition and retention of TCF’s deposit
customer base.
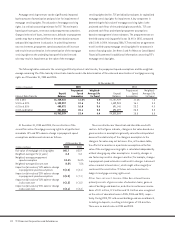
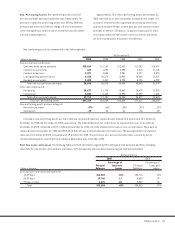
Deposit Account Losses Deposit account losses totaled
$20.5 million in 2005, down $1.9 million from 2004, primarily due
to lower net uncollectible overdraft losses, partially offset by
higher external fraud losses. Deposit account losses increased
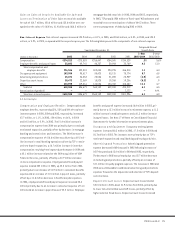
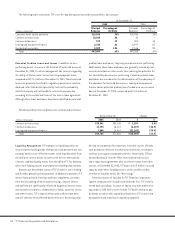
Gains on Sales of Securities Available for Sale and
Losses on Termination of Debt Gains on securities available
for sale of $10.7 million, $22.6 million and $32.8 million were rec-
ognized on the sales of $1 billion, $1.4 billion and $816.5 million in
mortgage-backed securities in 2005, 2004 and 2003, respectively.
In 2003, TCF prepaid $954 million of fixed-rate FHLB advances and
recorded losses on terminations of debt of $44.3 million. There
were no prepayments of debt during 2005 or 2004.