TCF Bank 2005 Annual Report Download - page 51
Download and view the complete annual report
Please find page 51 of the 2005 TCF Bank annual report below. You can navigate through the pages in the report by either clicking on the pages listed below, or by using the keyword search tool below to find specific information within the annual report.-
 1
1 -
2
-
3
-
4
-
5
-
6
-
7
-
8
-
9
-
10
-
11
-
12
-
13
-
14
-
15
-
16
-
17
-
18
-
19
-
20
-
21
-
22
-
23
-
24
-
25
-
26
-
27
-
28
-
29
-
30
-
31
-
32
-
33
-
34
-
35
-
36
-
37
-
38
-
39
-
40
-
 41
41 -
 42
42 -
 43
43 -
 44
44 -
 45
45 -
 46
46 -
 47
47 -
 48
48 -
 49
49 -
 50
50 -
 51
51 -
 52
52 -
 53
53 -
 54
54 -
 55
55 -
 56
56 -
 57
57 -
 58
58 -
 59
59 -
 60
60 -
 61
61 -
62
-
63
-
64
-
65
-
66
-
67
-
68
-
69
-
70
-
71
-
72
-
73
-
74
-
75
-
76
-
77
-
78
-
79
-
80
-
81
-
82
-
83
-
84
-
85
-
86
-
87
-
88
-
89
-
90
-
91
-
92
-
93
-
94
-
95
-
96
-
97
-
98
-
99
-
100
-
101
-
102
-
103
-
104
-
105
-
106
 |
 |

312005 Form 10-K
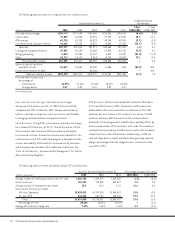
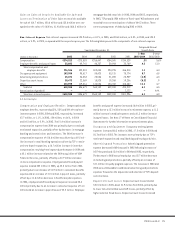
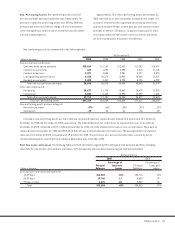
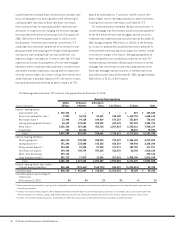
The following table sets forth information detailing the allowance for loan and lease losses and selected key indicators:
Year Ended December 31,
(Dollars in thousands) 2005 2004 2003 2002 2001
Balance at beginning of year $ 79,878 $ 76,619 $ 77,008 $ 75,028 $ 66,669
Charge-offs:
Consumer home equity and other (6,359) (4,821) (5,362) (6,939) (6,605)
Commercial real estate (74) (602) (1,381) (2,181) (122)
Commercial business (704) (235) (920) (5,952) (429)
Leasing and equipment finance (23,137) (8,508) (8,620) (9,230) (9,794)
Residential real estate (110) (81) (86) (59) (1)
Total charge-offs (30,384) (14,247) (16,369) (24,361) (16,951)
Recoveries:
Consumer home equity and other 1,149 1,589 2,173 2,965 3,487
Commercial real estate 82 126 45 43 103
Commercial business 2,986 82 138 54 193
Leasing and equipment finance 1,644 2,963 1,083 1,264 649
Residential real estate 19 8 9 9 -
Total recoveries 5,880 4,768 3,448 4,335 4,432
Net charge-offs (24,504) (9,479) (12,921) (20,026) (12,519)
Provision charged to operations 5,022 10,947 12,532 22,006 20,878
Acquired allowance –1,791 – – –
Balance at end of year $ 60,396 $ 79,878 $ 76,619 $ 77,008 $ 75,028
Key Indicators:
Net charge-offs as a percentage of average
loans and leases .25% .11% .16% .25% .15%
Year-end allowance as a multiple of net charge-offs 2.5X 8.4 X 5.9 X 3.8 X 6.0 X
Income before income taxes and provision for loan losses
as a multiple of net charge-offs 15.7X 41.7 X 26.3 X 19.0 X 28.0 X
The Company considers the allowance for loan and lease losses of
$60.4 million appropriate to cover losses inherent in the loan and
lease portfolios as of December 31, 2005. However, no assurance
can be given that TCF will not, in any particular period, sustain
loan and lease losses that are sizable in relation to the amount
reserved, or that subsequent evaluations of the loan and lease
portfolio, in light of factors then prevailing, including economic
conditions and TCF’s ongoing credit review process, will not
require significant changes (increases or decreases) in the
allowance for loan and lease losses and the associated provisions
for credit losses. Among other factors, a protracted economic
slowdown and/or a decline in commercial or residential real estate
values in TCF’s markets may have an adverse impact on the ade-
quacy of the allowance for loan and lease losses by increasing
credit risk and the risk of potential loss. See “Forward-Looking
Information” and Notes 1 and 6 of Notes to Consolidated Financial
Statements for additional information concerning TCF’s allowance
for loan and lease losses.
The next several pages include detailed information regarding
TCF’s allowance for loan and lease losses, net charge-offs,
non-performing assets, past due loans and leases and potential
problem loans and leases. Included in this data are numerous
portfolio ratios that must be carefully reviewed and related to the
nature of the underlying loan and lease portfolios before appro-
priate conclusions can be reached regarding TCF or for purposes
of making comparisons to other companies. Most of TCF’s non-
performing assets and past due loans and leases are secured by
residential real estate. Given the nature of these assets and the
related mortgage foreclosure, property sale and, if applicable,
mortgage insurance claims processes, it can take 18 months or
longer for a loan to migrate from initial delinquency to final
disposition. This resolution process generally takes much longer
for loans secured by real estate than for unsecured loans or loans
secured by other property primarily due to state foreclosure laws.
The key indicators of TCF’s credit quality and reserve coverage
for 2005 include the ratio of net charge-offs to average loans
and leases of .25%, the year-end allowance as a multiple of net
charge-offs of 2.5X, and income before income taxes and provi-
sion for loan losses as a multiple of net charge-offs of 15.7X.