TCF Bank 2005 Annual Report Download - page 63
Download and view the complete annual report
Please find page 63 of the 2005 TCF Bank annual report below. You can navigate through the pages in the report by either clicking on the pages listed below, or by using the keyword search tool below to find specific information within the annual report.-
 1
1 -
2
-
3
-
4
-
5
-
6
-
7
-
8
-
9
-
10
-
11
-
12
-
13
-
14
-
15
-
16
-
17
-
18
-
19
-
20
-
21
-
22
-
23
-
24
-
25
-
26
-
27
-
28
-
29
-
30
-
31
-
32
-
33
-
34
-
35
-
36
-
37
-
38
-
39
-
40
-
41
-
42
-
43
-
44
-
45
-
46
-
47
-
48
-
49
-
50
-
51
-
52
-
 53
53 -
 54
54 -
 55
55 -
 56
56 -
 57
57 -
 58
58 -
 59
59 -
 60
60 -
 61
61 -
 62
62 -
 63
63 -
 64
64 -
 65
65 -
 66
66 -
 67
67 -
 68
68 -
 69
69 -
 70
70 -
 71
71 -
 72
72 -
 73
73 -
74
-
75
-
76
-
77
-
78
-
79
-
80
-
81
-
82
-
83
-
84
-
85
-
86
-
87
-
88
-
89
-
90
-
91
-
92
-
93
-
94
-
95
-
96
-
97
-
98
-
99
-
100
-
101
-
102
-
103
-
104
-
105
-
106
 |
 |

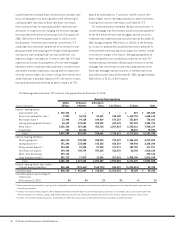
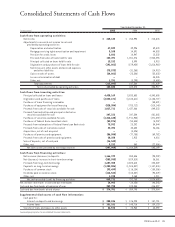
432005 Form 10-K
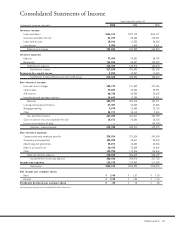
Year Ended December 31,
(In thousands, except per-share data) 2005 2004 2003
Interest income:
Loans and leases $636,172 $527,178 $513,171
Securities available for sale 81,479 80,643 103,821
Loans held for sale 10,921 11,533 20,016
Investments 3,450 3,455 4,511
Total interest income 732,022 622,809 641,519
Interest expense:
Deposits 97,406 42,581 56,795
Borrowings 116,926 88,337 103,579
Total interest expense 214,332 130,918 160,374
Net interest income 517,690 491,891 481,145
Provision for credit losses 5,022 10,947 12,532
Net interest income after provision for credit losses 512,668 480,944 468,613
Non-interest income:
Fees and service charges 258,779 271,259 247,456
Card revenue 79,803 63,463 52,991
ATM revenue 40,730 42,935 43,623
Investments and insurance revenue 10,665 12,558 13,901
Subtotal 389,977 390,215 357,971
Leasing and equipment finance 47,387 50,323 51,088
Mortgage banking 5,578 12,960 12,719
Other 24,717 14,113 9,014
Fees and other revenue 467,659 467,611 430,792
Gains on sales of securities available for sale 10,671 22,600 32,832
Losses on termination of debt –– (44,345)
Total non-interest income 478,330 490,211 419,279
Non-interest expense:
Compensation and employee benefits 326,526 322,824 302,804
Occupancy and equipment 103,900 95,617 88,423
Advertising and promotions 25,691 26,353 25,536
Deposit account losses 20,473 22,369 18,820
Other 133,998 119,516 124,526
Total non-interest expense 610,588 586,679 560,109
Income before income tax expense 380,410 384,476 327,783
Income tax expense 115,278 129,483 111,905
Net income $265,132 $254,993 $215,878
Net income per common share:
Basic $ 2.00 $ 1.87 $ 1.53
Diluted $ 2.00 $ 1.86 $ 1.53
Dividends declared per common share $ .85 $ .75 $ .65
See accompanying notes to consolidated financial statements.
Consolidated Statements of Income