TCF Bank 2005 Annual Report Download - page 53
Download and view the complete annual report
Please find page 53 of the 2005 TCF Bank annual report below. You can navigate through the pages in the report by either clicking on the pages listed below, or by using the keyword search tool below to find specific information within the annual report.-
 1
1 -
2
-
3
-
4
-
5
-
6
-
7
-
8
-
9
-
10
-
11
-
12
-
13
-
14
-
15
-
16
-
17
-
18
-
19
-
20
-
21
-
22
-
23
-
24
-
25
-
26
-
27
-
28
-
29
-
30
-
31
-
32
-
33
-
34
-
35
-
36
-
37
-
38
-
39
-
40
-
41
-
42
-
 43
43 -
 44
44 -
 45
45 -
 46
46 -
 47
47 -
 48
48 -
 49
49 -
 50
50 -
 51
51 -
 52
52 -
 53
53 -
 54
54 -
 55
55 -
 56
56 -
 57
57 -
 58
58 -
 59
59 -
 60
60 -
 61
61 -
 62
62 -
 63
63 -
64
-
65
-
66
-
67
-
68
-
69
-
70
-
71
-
72
-
73
-
74
-
75
-
76
-
77
-
78
-
79
-
80
-
81
-
82
-
83
-
84
-
85
-
86
-
87
-
88
-
89
-
90
-
91
-
92
-
93
-
94
-
95
-
96
-
97
-
98
-
99
-
100
-
101
-
102
-
103
-
104
-
105
-
106
 |
 |

332005 Form 10-K
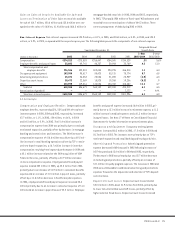
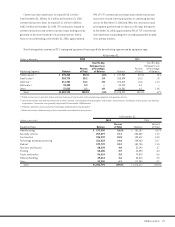
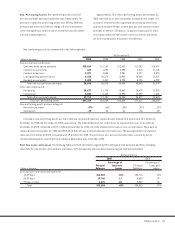
Non-Performing Assets Non-performing assets consist of
non-accrual loans and leases and other real estate owned. The
decrease in total non-performing assets from 2004 to 2005 was
primarily due to the $18.8 million charge-off of the investment
in the leveraged lease and the sale of several foreclosed commer-
cial real estate properties.
Approximately 75% of non-performing assets at December 31,
2005 consisted of, or were secured by, residential real estate. The
accrual of interest income is generally discontinued when loans
and leases become 90 days or more past due with respect to either
principal or interest (150 days or six payments past due for loans
secured by residential real estate) unless such loans and leases
are well secured and in the process of collection.
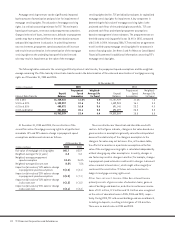
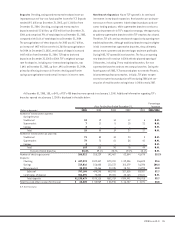
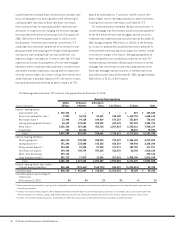
Non-performing assets are summarized in the following table:
At December 31,
(Dollars in thousands) 2005 2004 2003 2002 2001
Non-accrual loans and leases:
Consumer home equity and other $18,410 $12,187 $12,052 $11,163 $16,473
Commercial real estate 188 1,093 2,490 3,213 11,135
Commercial business 2,207 4,533 2,931 4,777 3,550
Leasing and equipment finance 6,434 25,678 13,940 18,689 13,857
Residential real estate 2,409 3,387 3,993 5,798 6,959
Total non-accrual loans and leases 29,648 46,878 35,406 43,640 51,974
Other real estate owned:
Residential 14,877 11,726 20,462 16,479 12,830
Commercial 2,834 5,465 12,992 10,093 1,825
Total other real estate owned 17,711 17,191 33,454 26,572 14,655
Total non-performing assets $47,359 $64,069 $68,860 $70,212 $66,629
Non-performing assets as a percentage of:
Net loans and leases .47% .69% .83% .87% .82%
Total assets .35 .52 .61 .58 .59
Included in non-performing assets are loans that are considered impaired. Impaired loans totaled $3.8 million and $8.1 million at
December 31, 2005 and December 31, 2004, respectively. The related allowance for credit losses on impaired loans was $1.6 million at
December 31, 2005, compared with $3.7 million at December 31, 2004. All of the impaired loans were on non-accrual status. There were no
impaired loans at December 31, 2005 and 2004 which did not have a related allowance for loan losses. The average balance of impaired
loans was $5.3 million for 2005, compared with $9.8 million for 2004. The increase in non-accrual consumer loans is primarily due to
increased bankruptcies resulting from a change in bankruptcy laws in October, 2005.
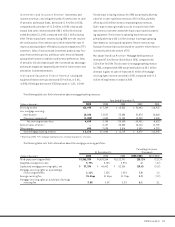
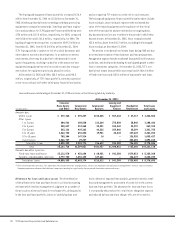
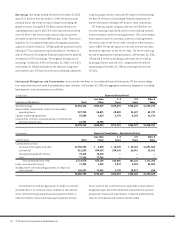
Past Due Loans and Leases The following table sets forth information regarding TCF’s delinquent loan and lease portfolio, excluding
loans held for sale and non-accrual loans and leases. TCF’s delinquency rates are determined using the contractual method.
At December 31,
2005 2004
Percentage of Percentage of
Principal Loans and Principal Loans and
(Dollars in thousands) Balances Leases Balances Leases
Accruing loans and leases delinquent for:
30-59 days $26,383 .26% $20,776 .23%
60-89 days 10,746 .11 8,659 .09
90 days or more 6,475 .06 4,950 .05
Total $43,604 .43% $34,385 .37%