TCF Bank 2005 Annual Report Download - page 88
Download and view the complete annual report
Please find page 88 of the 2005 TCF Bank annual report below. You can navigate through the pages in the report by either clicking on the pages listed below, or by using the keyword search tool below to find specific information within the annual report.-
 1
1 -
2
-
3
-
4
-
5
-
6
-
7
-
8
-
9
-
10
-
11
-
12
-
13
-
14
-
15
-
16
-
17
-
18
-
19
-
20
-
21
-
22
-
23
-
24
-
25
-
26
-
27
-
28
-
29
-
30
-
31
-
32
-
33
-
34
-
35
-
36
-
37
-
38
-
39
-
40
-
41
-
42
-
43
-
44
-
45
-
46
-
47
-
48
-
49
-
50
-
51
-
52
-
53
-
54
-
55
-
56
-
57
-
58
-
59
-
60
-
61
-
62
-
63
-
64
-
65
-
66
-
67
-
68
-
69
-
70
-
71
-
72
-
73
-
74
-
75
-
76
-
77
-
 78
78 -
 79
79 -
 80
80 -
 81
81 -
 82
82 -
 83
83 -
 84
84 -
 85
85 -
 86
86 -
 87
87 -
 88
88 -
 89
89 -
 90
90 -
 91
91 -
 92
92 -
 93
93 -
 94
94 -
 95
95 -
 96
96 -
 97
97 -
 98
98 -
99
-
100
-
101
-
102
-
103
-
104
-
105
-
106
 |
 |

68 TCF Financial Corporation and Subsidiaries
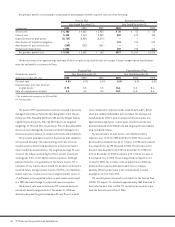
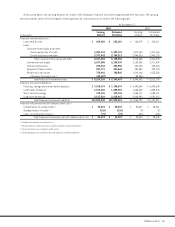
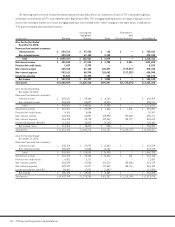
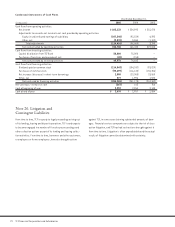
The following table sets forth certain information about the reported profit or loss and assets of each of TCF’s reportable segments,
including a reconciliation of TCF’s consolidated totals. Beginning in 2005, TCF’s mortgage banking business no longer originates or sells
loans to the secondary market. As a result, mortgage banking is now included in the “other” category in the table below, in addition to
TCF’s parent company and corporate functions.
Leasing and Eliminations
Equipment and
(In thousands) Banking Finance Other Reclassifications Consolidated
At or For the Year Ended
December 31, 2005:
Revenues from external customers:
Interest income $ 634,312 $ 97,596 $ 114 $ – $ 732,022
Non-interest income 425,105 47,465 5,760 – 478,330
Total $ 1,059,417 $ 145,061 $ 5,874 $ – $ 1,210,352
Net interest income $ 455,550 $ 57,014 $ 2,780 $ 2,346 $517,690
Provision for credit losses 1,029 3,993 – – 5,022
Non-interest income 425,105 47,465 125,337 (119,577) 478,330
Non-interest expense 553,161 48,596 126,062 (117,231) 610,588
Income tax expense 96,532 18,493 253 – 115,278
Net income $ 229,933 $ 33,397 $ 1,802 $ – $ 265,132
Total assets $12,908,059 $1,635,528 $195,447 $(1,373,674) $13,365,360
At or For the Year Ended
December 31, 2004:
Revenues from external customers:
Interest income $ 529,281 $ 89,364 $ 4,164 $ – $ 622,809
Non-interest income 426,580 50,697 12,934 – 490,211
Total $ 955,861 $ 140,061 $ 17,098 $ – $ 1,113,020
Net interest income $ 427,521 $ 55,699 $ 7,336 $ 1,335 $ 491,891
Provision for credit losses 4,141 6,806 – – 10,947
Non-interest income 426,580 50,697 109,996 (97,062) 490,211
Non-interest expense 516,426 43,718 122,262 (95,727) 586,679
Income tax expense (benefit) 113,628 20,000 (4,145) – 129,483
Net income (loss) $ 219,906 $ 35,872 $ (785) $ – $ 254,993
Total assets $ 11,891,260 $ 1,460,778 $ 212,701 $ (1,224,172) $ 12,340,567
At or For the Year Ended
December 31, 2003:
Revenues from external customers:
Interest income $ 545,764 $ 81,912 $ 13,843 $ – $ 641,519
Non-interest income 355,039 51,088 13,152 – 419,279
Total $ 900,803 $ 133,000 $ 26,995 $ – $ 1,060,798
Net interest income $ 415,202 $ 45,358 $ 20,244 $ 341 $ 481,145
Provision for credit losses 4,361 8,171 – – 12,532
Non-interest income 355,039 51,088 102,210 (89,058) 419,279
Non-interest expense 489,287 41,977 117,562 (88,717) 560,109
Income tax expense (benefit) 96,421 17,031 (1,547) – 111,905
Net income $ 180,172 $ 29,267 $ 6,439 $ – $ 215,878
Total assets $ 10,902,749 $ 1,228,208 $ 301,252 $ (1,113,194) $ 11,319,015