TCF Bank 2005 Annual Report Download - page 36
Download and view the complete annual report
Please find page 36 of the 2005 TCF Bank annual report below. You can navigate through the pages in the report by either clicking on the pages listed below, or by using the keyword search tool below to find specific information within the annual report.-
 1
1 -
2
-
3
-
4
-
5
-
6
-
7
-
8
-
9
-
10
-
11
-
12
-
13
-
14
-
15
-
16
-
17
-
18
-
19
-
20
-
21
-
22
-
23
-
24
-
25
-
 26
26 -
 27
27 -
 28
28 -
 29
29 -
 30
30 -
 31
31 -
 32
32 -
 33
33 -
 34
34 -
 35
35 -
 36
36 -
 37
37 -
 38
38 -
 39
39 -
 40
40 -
 41
41 -
 42
42 -
 43
43 -
 44
44 -
 45
45 -
 46
46 -
47
-
48
-
49
-
50
-
51
-
52
-
53
-
54
-
55
-
56
-
57
-
58
-
59
-
60
-
61
-
62
-
63
-
64
-
65
-
66
-
67
-
68
-
69
-
70
-
71
-
72
-
73
-
74
-
75
-
76
-
77
-
78
-
79
-
80
-
81
-
82
-
83
-
84
-
85
-
86
-
87
-
88
-
89
-
90
-
91
-
92
-
93
-
94
-
95
-
96
-
97
-
98
-
99
-
100
-
101
-
102
-
103
-
104
-
105
-
106
 |
 |

16 TCF Financial Corporation and Subsidiaries
Opening new branches is an integral part of TCF’s growth
strategy for generating new deposit accounts and the related
revenue that is associated with the accounts and other products.
New branches typically produce net losses during the first 20-24
months of operations before they become profitable, and there-
fore the level and timing of new branch expansion can have a
significant impact on TCF’s profitability. TCF’s growth in checking
accounts is primarily occurring in new branches with growth in
older, mature branches being slower. The success of TCF’s branch
expansion is dependent on the continued long-term success and
viability of branch banking.
TCF’s lending strategy is to originate high credit quality, pri-
marily secured, loans and leases. Commercial loans are generally
made on local properties or to local customers. TCF’s largest core
lending business is its consumer home equity loan operation, which
offers fixed- and variable-rate loans and lines of credit secured
by residential real estate properties. The leasing and equipment
finance businesses consist of TCF Equipment Finance, Inc. (“TCF
Equipment Finance”), a company that delivers equipment finance
solutions to businesses in select markets, and Winthrop Resources
Corporation (“Winthrop”), a leasing company that primarily leases
technology and data processing equipment. TCF’s leasing and
equipment finance businesses operate in all 50 states and source
equipment installations domestically and, to a limited extent, in
foreign countries.
As a primarily secured lender, TCF emphasizes credit quality
over asset growth. As a result, TCF’s credit losses are generally
lower than those experienced by other banks. The allowance for
loan and lease losses, while generally lower as a percent of loans
and leases than the average in the banking industry, reflects
the lower historical charge-offs and management’s expectation
of the risk of loss inherent in the loan and lease portfolio. See
“Consolidated Financial Condition Analysis – Allowance for Loan
and Lease Losses.”
Net interest income, the difference between interest income
earned on loans and leases and on investments, and interest
expense paid on deposits and short-term and long-term borrow-
ings, represented 52% of TCF’s total revenue in 2005. Net interest
income can change significantly from period to period based on
general levels of interest rates, customer prepayment patterns,
the mix of interest-earning assets and the mix of interest-bearing
and non-interest bearing deposits and borrowings. TCF manages
the risk of changes in interest rates on its net interest income
through an Asset/Liability Committee and through related interest-
rate risk monitoring and management policies.
During 2005, TCF’s net interest margin declined from 4.54%
for 2004 to 4.46% for 2005. This decline was primarily due to
growth in deposits with higher interest rates and increased fixed-
rate loans with lower yields than variable-rate loans as a result
of the flattening yield curve and changing customer preferences.
See “Quantitative and Qualitative Disclosures About Market Risk”
for further discussion on TCF’s interest-rate risk position.
Non-interest income is a significant source of revenue for
TCF and an important factor in TCF’s results of operations. A
key driver of non-interest income is checking accounts and their
related activities. Increasing fee and service charge revenues
has been challenging during 2005 as a result of slower growth
in checking accounts and changing customer behaviors. Fee
revenue per retail checking account was $217 for 2005, down
from $232 in 2004. TCF is focusing on checking account growth
to increase future fee revenue. See “Management’s Discussion
and Analysis of Financial Condition and Results of Operations –
Consolidated Income Statement Analysis – Non-Interest
Income” for additional information.
The Company’s Visa debit card program has grown significantly
since its inception in 1996. TCF is one of the largest issuers of Visa
Classic debit cards in the United States. TCF earns interchange
revenue from customer debit card transactions.
The following portions of the Management’s Discussion and
Analysis of Financial Condition and Results of Operations focus
in more detail on the results of operations for 2005, 2004 and
2003 and on information about TCF’s balance sheet, credit quality,
liquidity and funding resources, capital and other matters.
Results of Operations
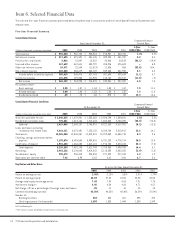
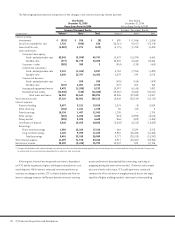
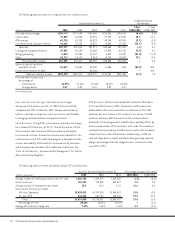
Performance Summary TCF reported diluted earnings per com-
mon share of $2.00 for 2005, compared with $1.86 for 2004 and
$1.53 for 2003. Net income was $265.1 million for 2005, compared
with $255 million for 2004 and $215.9 million for 2003. Return on
average assets was 2.08% in 2005, compared with 2.15% in 2004
and 1.85% in 2003. Return on average common equity was 28.03%
in 2005, compared with 27.02% in 2004 and 23.05% in 2003. During
2003, TCF prepaid $954 million of high-cost FHLB borrowings,
incurring early termination fees of $44.3 million ($29.2 million
after-tax) which reduced diluted earnings per share by 21 cents.
There were no debt terminations in 2005 or 2004. The effective
income tax rate for 2005 was 30.30%, compared with 33.68% in
2004 and 34.14% in 2003.