TCF Bank 2005 Annual Report Download - page 43
Download and view the complete annual report
Please find page 43 of the 2005 TCF Bank annual report below. You can navigate through the pages in the report by either clicking on the pages listed below, or by using the keyword search tool below to find specific information within the annual report.-
 1
1 -
2
-
3
-
4
-
5
-
6
-
7
-
8
-
9
-
10
-
11
-
12
-
13
-
14
-
15
-
16
-
17
-
18
-
19
-
20
-
21
-
22
-
23
-
24
-
25
-
26
-
27
-
28
-
29
-
30
-
31
-
32
-
 33
33 -
 34
34 -
 35
35 -
 36
36 -
 37
37 -
 38
38 -
 39
39 -
 40
40 -
 41
41 -
 42
42 -
 43
43 -
 44
44 -
 45
45 -
 46
46 -
 47
47 -
 48
48 -
 49
49 -
 50
50 -
 51
51 -
 52
52 -
 53
53 -
54
-
55
-
56
-
57
-
58
-
59
-
60
-
61
-
62
-
63
-
64
-
65
-
66
-
67
-
68
-
69
-
70
-
71
-
72
-
73
-
74
-
75
-
76
-
77
-
78
-
79
-
80
-
81
-
82
-
83
-
84
-
85
-
86
-
87
-
88
-
89
-
90
-
91
-
92
-
93
-
94
-
95
-
96
-
97
-
98
-
99
-
100
-
101
-
102
-
103
-
104
-
105
-
106
 |
 |

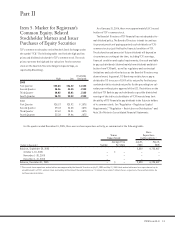
232005 Form 10-K
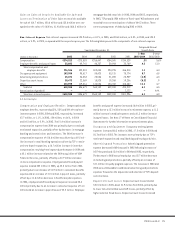
Investments and Insurance Revenue Investments and
insurance revenue, consisting principally of commissions on sales
of annuities and mutual funds, decreased $1.9 million in 2005,
compared with a decrease of $1.3 million in 2004. Annuity and
mutual fund sales volumes totaled $188.2 million for the year
ended December 31, 2005, compared with $212.2 million during
2004. The decreased sales volumes during 2005 were the result of
the continuation of low interest rates which reduced the rate of
return on annuity products offered by insurance companies to TCF’s
customers. Sales of insurance and investment products may fluc-
tuate from period to period, and future sales levels will depend
upon general economic conditions and investor preferences. Sales
of annuities will also depend upon their continued tax advantage
and may be negatively impacted by the level of interest rates and
alternative investment products.
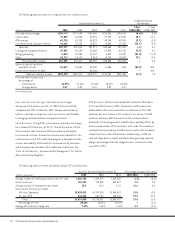
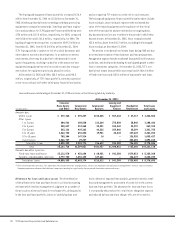
Leasing and Equipment Finance Revenue Leasing and
equipment finance revenues decreased $2.9 million, or 5.8%,
in 2005, following a decrease of $765 thousand, or 1.5%, in 2004.
The decrease in leasing revenues for 2005 was primarily driven by
a decline in sales-type lease revenues of $10 million, partially
offset by a $6.5 million increase in operating lease revenues.
Sales-type revenues generally occur at or near the end of the
lease term as customers extend the lease or purchase the underly-
ing equipment. The increase in operating lease revenues was
primarily driven by a $25.1 million increase in average operating
lease balances. Leasing and equipment finance revenues may
fluctuate from period to period based on customer-driven factors
not entirely within the control of TCF.
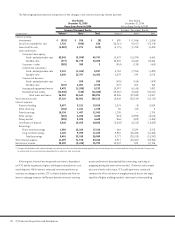
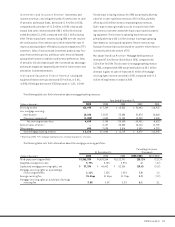
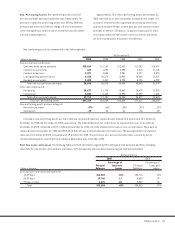
Mortgage Banking Revenue Mortgage banking revenue
decreased $7.4 million to $5.6 million in 2005, compared with
$13 million for 2004. The decrease in mortgage banking revenue
for 2005, compared with 2004 was primarily due to a $8.1 million
decrease in gains on sales of loans and $1 million of mortgage
servicing rights recovery recorded in 2005, compared with $1.5
million of impairment recorded in 2004.
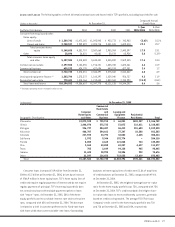
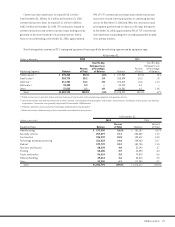
The following table sets forth information about mortgage banking revenues:
Year Ended December 31,
(Dollars in thousands) 2005 2004 2003 2002 2001
Servicing income $13,998 $17,349 $ 20,533 $ 20,443 $16,932
Less mortgage servicing:
Amortization 10,108 13,091 23,680 22,874 16,564
(Recovery) impairment (1,000) 1,500 21,153 12,500 4,400
Net servicing income (loss) 4,890 2,758 (24,300) (14,931) (4,032)
Gains on sales of loans (1) –8,107 33,505 18,110 11,795
Other income 688 2,095 3,514 3,800 4,279
Total mortgage banking revenue $ 5,578 $12,960 $ 12,719 $ 6,979 $12,042
(1) Beginning in 2005, TCF’s mortgage banking business no longer originates or sells loans.
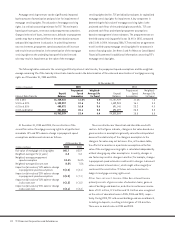
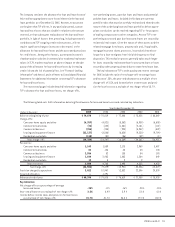
The following table sets forth information about the mortgage servicing portfolio:
Percentage Increase
At December 31, (Decrease)
(Dollars in thousands) 2005 2004 2003 2005/2004 2004/2003
Third-party servicing portfolio $3,362,339 $4,503,564 $5,122,741 (25.3)% (12.1)%
Weighted-average note rate 5.79% 5.78% 5.97% .2 (3.2)
Capitalized mortgage servicing rights, net $ 37,334 $ 46,442 $ 52,036 (19.6) (10.8)
Mortgage servicing rights as a percentage
of servicing portfolio 1.11% 1.03% 1.02% 7.8 1.0
Average servicing fee 31.4 bps 31.0bps 31.7bps 1.3 (2.2)
Mortgage servicing rights as a multiple of average
servicing fee 3.5 X 3.3X 3.2X 6.1 3.1