TCF Bank 2005 Annual Report Download - page 34
Download and view the complete annual report
Please find page 34 of the 2005 TCF Bank annual report below. You can navigate through the pages in the report by either clicking on the pages listed below, or by using the keyword search tool below to find specific information within the annual report.-
 1
1 -
2
-
3
-
4
-
5
-
6
-
7
-
8
-
9
-
10
-
11
-
12
-
13
-
14
-
15
-
16
-
17
-
18
-
19
-
20
-
21
-
22
-
23
-
 24
24 -
 25
25 -
 26
26 -
 27
27 -
 28
28 -
 29
29 -
 30
30 -
 31
31 -
 32
32 -
 33
33 -
 34
34 -
 35
35 -
 36
36 -
 37
37 -
 38
38 -
 39
39 -
 40
40 -
 41
41 -
 42
42 -
 43
43 -
 44
44 -
45
-
46
-
47
-
48
-
49
-
50
-
51
-
52
-
53
-
54
-
55
-
56
-
57
-
58
-
59
-
60
-
61
-
62
-
63
-
64
-
65
-
66
-
67
-
68
-
69
-
70
-
71
-
72
-
73
-
74
-
75
-
76
-
77
-
78
-
79
-
80
-
81
-
82
-
83
-
84
-
85
-
86
-
87
-
88
-
89
-
90
-
91
-
92
-
93
-
94
-
95
-
96
-
97
-
98
-
99
-
100
-
101
-
102
-
103
-
104
-
105
-
106
 |
 |

14 TCF Financial Corporation and Subsidiaries
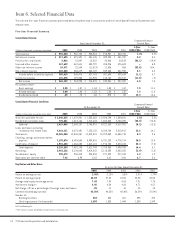
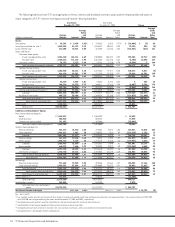
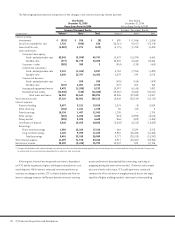
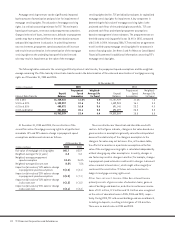
Item 6. Selected Financial Data
The selected five-year financial summary presented below should be read in conjunction with the Consolidated Financial Statements and
related notes.
Five-Year Financial Summary
Consolidated Income:
Compound Annual
Year Ended December 31, Growth Rate
1-Year 5-Year
(Dollars in thousands, except per-share data) 2005 2004 2003 2002 2001 2005/2004 2005/2000
Total revenue $ 996,020 $ 982,102 $ 900,424 $ 918,987 $ 852,708 1.4% 5.2%
Net interest income $ 517,690 $ 491,891 $ 481,145 $ 499,225 $ 481,222 5.2 3.4
Provision for credit losses 5,022 10,947 12,532 22,006 20,878 (54.1) (19.4)
Fees and other revenue 467,659 467,611 430,792 408,226 370,623 –6.8
Other non-interest income 10,671 22,600 (11,513) 11,536 863 (52.8) N.M.
Non-interest expense 610,588 586,679 560,109 539,288 501,996 4.1 6.0
Income before income tax expense 380,410 384,476 327,783 357,693 329,834 (1.1) 4.7
Income tax expense 115,278 129,483 111,905 124,762 122,512 (11.0) (.2)
Net income $ 265,132 $ 254,993 $ 215,878 $ 232,931 $ 207,322 4.0 7.3
Per common share:
Basic earnings $ 2.00 $ 1.87 $ 1.53 $ 1.58 $ 1.37 7.0 11.1
Diluted earnings $ 2.00 $ 1.86 $ 1.53 $ 1.58 $ 1.35 7.5 11.3
Dividends declared $ .85 $ .75 $ .65 $ .575 $ .50 13.3 15.6
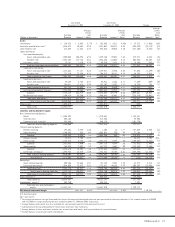
Consolidated Financial Condition:
Compound Annual
At December 31, Growth Rate
1-Year 5-Year
(Dollars in thousands, except per share data) 2005 2004 2003 2002 2001 2005/2004 2005/2000
Securities available for sale $ 1,648,615 $ 1,619,941 $ 1,533,288 $ 2,426,794 $ 1,584,661 1.8% 3.3%
Residential real estate loans 770,441 1,014,166 1,212,643 1,800,344 2,733,290 (24.0) (26.8)
Subtotal 2,419,056 2,634,107 2,745,931 4,227,138 4,317,951 (8.2) (13.8)
Loans and leases excluding
residential real estate loans 9,424,111 8,372,491 7,135,135 6,320,784 5,510,912 12.6 14.1
Total assets 13,365,360 12,340,567 11,319,015 12,202,069 11,358,715 8.3 3.6
Checking, savings and money market
deposits 7,195,074 6,493,545 5,999,626 5,791,233 4,778,714 10.8 12.0
Certificates of deposit 1,915,620 1,468,650 1,612,123 1,918,755 2,320,244 30.4 (7.3)
Total deposits 9,110,694 7,962,195 7,611,749 7,709,988 7,098,958 14.4 5.7
Borrowings 2,983,136 3,104,603 2,414,825 3,110,295 3,023,025 (3.9) (1.3)
Stockholders’ equity 998,472 958,418 920,858 977,020 917,033 4.2 1.9
Book value per common share 7.46 6.99 6.53 6.61 5.96 6.7 5.6
Key Ratios and Other Data:
At or For the Year Ended December 31,
2005 2004 2003 2002 2001
Return on average assets 2.08% 2.15% 1.85% 2.01% 1.79%
Return on average equity 28.03 27.02 23.05 25.38 23.06
Average total equity to average assets 7.43 7.94 8.03 7.91 7.78
Net interest margin(1) 4.46 4.54 4.54 4.71 4.51
Net charge-offs as a percentage of average loans and leases .25 .11 .16 .25 .15
Common dividend payout ratio 42.50% 40.32% 42.48% 36.39% 37.04%
Number of:
Banking locations 453 430 401 395 375
Checking accounts (in thousands) 1,603 1,535 1,444 1,338 1,249
N.M. Not Meaningful.
(1) Net interest income divided by average interest-earning assets.