TCF Bank 2005 Annual Report Download - page 49
Download and view the complete annual report
Please find page 49 of the 2005 TCF Bank annual report below. You can navigate through the pages in the report by either clicking on the pages listed below, or by using the keyword search tool below to find specific information within the annual report.-
 1
1 -
2
-
3
-
4
-
5
-
6
-
7
-
8
-
9
-
10
-
11
-
12
-
13
-
14
-
15
-
16
-
17
-
18
-
19
-
20
-
21
-
22
-
23
-
24
-
25
-
26
-
27
-
28
-
29
-
30
-
31
-
32
-
33
-
34
-
35
-
36
-
37
-
38
-
 39
39 -
 40
40 -
 41
41 -
 42
42 -
 43
43 -
 44
44 -
 45
45 -
 46
46 -
 47
47 -
 48
48 -
 49
49 -
 50
50 -
 51
51 -
 52
52 -
 53
53 -
 54
54 -
 55
55 -
 56
56 -
 57
57 -
 58
58 -
 59
59 -
60
-
61
-
62
-
63
-
64
-
65
-
66
-
67
-
68
-
69
-
70
-
71
-
72
-
73
-
74
-
75
-
76
-
77
-
78
-
79
-
80
-
81
-
82
-
83
-
84
-
85
-
86
-
87
-
88
-
89
-
90
-
91
-
92
-
93
-
94
-
95
-
96
-
97
-
98
-
99
-
100
-
101
-
102
-
103
-
104
-
105
-
106
 |
 |

292005 Form 10-K
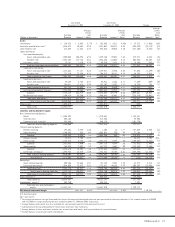
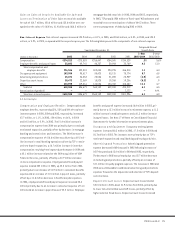
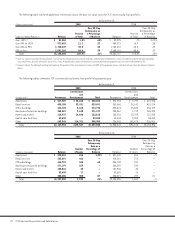
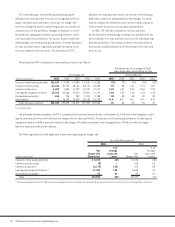
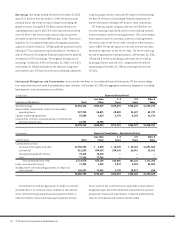
The following tables summarize TCF’s leasing and equipment finance portfolio by marketing segment and by equipment type:
At December 31,
(Dollars in thousands) 2005 2004
Over 30-Day Over 30-Day
Delinquency as Delinquency as
Percent a Percentage Percent a Percentage
Marketing Segment Balance of Total of Balance Balance of Total of Balance
Middle market (1) $ 878,414 58.4% .26% $ 747,964 54.4% .51%
Small ticket(2) 303,778 20.2 .53 258,094 18.8 .75
Winthrop(3) 211,741 14.1 .98 200,819 14.6 1.10
Wholesale (4) 78,338 5.2 – 83,913 6.1 –
Other 31,523 2.1 .60 84,582 6.1 1.68
Total $1,503,794 100.0% .41% $1,375,372 100.0% .67%
(1) Middle market consists primarily of loan and lease financing of construction and manufacturing equipment and speciality vehicles.
(2) Small ticket includes loan and lease financings to small- and mid-size companies through programs with vendors, manufacturers, distributors, buying groups, and franchise
organizations. Transaction sizes generally range from $25 thousand to $250 thousand.
(3) Winthrop’s portfolio consists primarily of technology and data processing equipment.
(4) Wholesale includes the discounting of lease receivables sourced by third-party lessors.
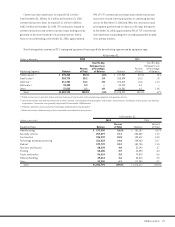
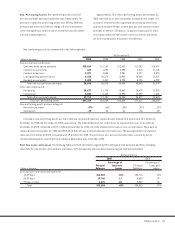
At December 31,
(Dollars in thousands) 2005 2004
Percent Percent
Equipment Type Balance of Total Balance of Total
Manufacturing $ 277,895 18.5% $ 251,157 18.2%
Specialty vehicles 257,497 17.1 236,582 17.2
Construction 236,939 15.8 182,612 13.3
Technology and data processing 222,623 14.8 229,160 16.7
Medical 199,729 13.3 157,745 11.5
Furniture and fixtures 60,278 4.0 51,192 3.7
Printing 58,600 3.9 45,394 3.3
Trucks and trailers 56,824 3.8 74,870 5.4
Material handling 39,814 2.6 33,810 2.5
Other 93,595 6.2 112,850 8.2
Total $1,503,794 100.0% $1,375,372 100.0%
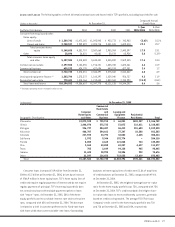
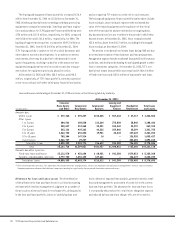
Commercial real estate loans increased $143.1 million
from December 31, 2004 to $2.3 billion at December 31, 2005.
Commercial business loans increased $11.1 million in 2005 to
$435.2 million at December 31, 2005. TCF continues to expand its
commercial business and commercial real estate lending activity
generally to borrowers located in its primary markets. With a
focus on secured lending, at December 31, 2005, approximately
99% of TCF’s commercial real estate and commercial business
loans were secured either by properties or underlying business
assets. At December 31, 2005 and 2004, the construction and
development portfolio had no loans over 30-days delinquent.
At December 31, 2005, approximately 93% of TCF’s commercial
real estate loans outstanding were secured by properties located
in its primary markets.