TCF Bank 2005 Annual Report Download - page 47
Download and view the complete annual report
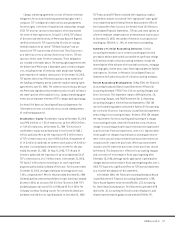
Please find page 47 of the 2005 TCF Bank annual report below. You can navigate through the pages in the report by either clicking on the pages listed below, or by using the keyword search tool below to find specific information within the annual report.-
 1
1 -
2
-
3
-
4
-
5
-
6
-
7
-
8
-
9
-
10
-
11
-
12
-
13
-
14
-
15
-
16
-
17
-
18
-
19
-
20
-
21
-
22
-
23
-
24
-
25
-
26
-
27
-
28
-
29
-
30
-
31
-
32
-
33
-
34
-
35
-
36
-
 37
37 -
 38
38 -
 39
39 -
 40
40 -
 41
41 -
 42
42 -
 43
43 -
 44
44 -
 45
45 -
 46
46 -
 47
47 -
 48
48 -
 49
49 -
 50
50 -
 51
51 -
 52
52 -
 53
53 -
 54
54 -
 55
55 -
 56
56 -
 57
57 -
58
-
59
-
60
-
61
-
62
-
63
-
64
-
65
-
66
-
67
-
68
-
69
-
70
-
71
-
72
-
73
-
74
-
75
-
76
-
77
-
78
-
79
-
80
-
81
-
82
-
83
-
84
-
85
-
86
-
87
-
88
-
89
-
90
-
91
-
92
-
93
-
94
-
95
-
96
-
97
-
98
-
99
-
100
-
101
-
102
-
103
-
104
-
105
-
106
 |
 |

272005 Form 10-K
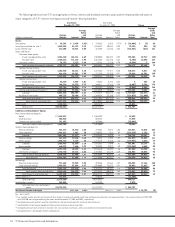
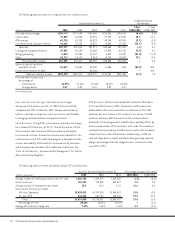
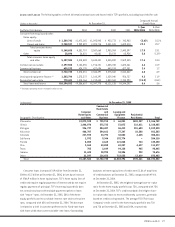
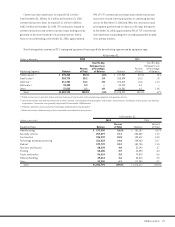
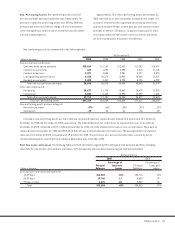
Loans and Leases The following tables set forth information about loans and leases held in TCF’s portfolio, excluding loans held for sale:
Compound Annual
(Dollars in thousands) At December 31, Growth Rate
1-Year 5-Year
Portfolio Distribution: 2005 2004 2003 2002 2001 2005/2004 2005/2000
Consumer home equity and other:
Home equity:
Lines of credit $ 1,389,741 $1,472,165 $1,093,945 $ 923,773 $ 743,983 (5.6)% 15.2%
Closed-end loans 3,758,947 2,909,592 2,493,715 2,031,531 1,699,414 29.2 20.7
Total consumer home
equity 5,148,688 4,381,757 3,587,660 2,955,304 2,443,397 17.5 19.1
Other 38,896 36,831 42,681 50,578 65,936 5.6 (13.9)
Total consumer home equity
and other 5,187,584 4,418,588 3,630,341 3,005,882 2,509,333 17.4 18.4
Commercial real estate 2,297,500 2,154,396 1,916,701 1,835,788 1,622,461 6.6 10.9
Commercial business 435,233 424,135 427,696 440,074 422,381 2.6 1.2
Total commercial 2,732,733 2,578,531 2,344,397 2,275,862 2,044,842 6.0 8.9
Leasing and equipment finance (1) 1,503,794 1,375,372 1,160,397 1,039,040 956,737 9.3 11.9
Residential real estate 770,441 1,014,166 1,212,643 1,800,344 2,733,290 (24.0) (26.8)
Total loans and leases $10,194,552 $9,386,657 $8,347,778 $8,121,128 $8,244,202 8.6 3.6
(1) Excludes operating leases included in other assets.
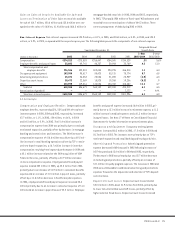
Consumer loans increased $769 million from December 31,
2004 to $5.2 billion at December 31, 2005, driven by an increase
of $766.9 million in home equity loans. TCF’s home equity lines of
credit only require regular payments of interest and do not require
regular payments of principal. TCF’s home equity portfolio does
not contain any loans with multiple payment options or loans
with “teaser” rates. At December 31, 2005, 38% of the home
equity portfolio carries a variable interest rate tied to the prime
rate, compared with 62% at December 31, 2004. This decrease
is related to a shift in customer preferences for fixed-rate loans
with lower yields than current variable-rate loans. Outstanding
balances on home equity lines of credit were 51.8% of total lines
of credit balances at December 31, 2005, compared with 49.6%
at December 31, 2004.
At December 31, 2005, the weighted-average loan-to-value
ratio for the home equity portfolio was 73%, compared with 75%
at December 31, 2004. TCF’s credit standards limit higher loan-
to-value ratio loans to more creditworthy customers, generally
based on credit scoring models. The average FICO (Fair Isaac
Company) credit score for the home equity portfolio was 720
and 716 at December 31, 2005 and 2004, respectively.
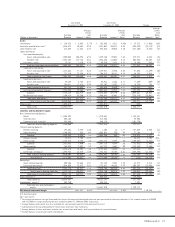
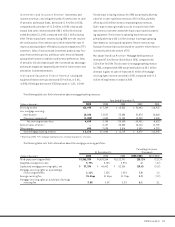
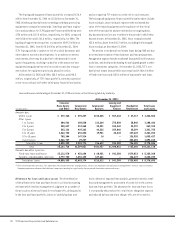
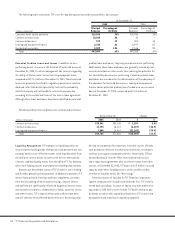
(In thousands) At December 31, 2005
Commercial
Real Estate
Consumer and Leasing and
Home Equity Commercial Equipment Residential
Geographic Distribution: and Other Business Finance Real Estate Total
Minnesota $2,072,538 $ 725,913 $ 66,051 $402,257 $ 3,266,759
Illinois 1,446,076 572,725 51,073 118,611 2,188,485
Michigan 926,737 804,487 86,413 201,683 2,019,320
Wisconsin 466,707 394,661 37,347 22,588 921,303
Colorado 227,925 33,792 34,082 4,625 300,424
California 1,992 9,344 192,774 – 204,110
Florida 8,003 2,665 121,848 734 133,250
Ohio 3,863 40,850 62,237 4,427 111,377
Texas 703 2,649 94,128 965 98,445
Indiana 11,443 28,995 34,306 932 75,676
Other 21,597 116,652 723,535 13,619 875,403
Total $5,187,584 $2,732,733 $1,503,794 $770,441 $10,194,552