TCF Bank 2005 Annual Report Download - page 42
Download and view the complete annual report
Please find page 42 of the 2005 TCF Bank annual report below. You can navigate through the pages in the report by either clicking on the pages listed below, or by using the keyword search tool below to find specific information within the annual report.-
 1
1 -
2
-
3
-
4
-
5
-
6
-
7
-
8
-
9
-
10
-
11
-
12
-
13
-
14
-
15
-
16
-
17
-
18
-
19
-
20
-
21
-
22
-
23
-
24
-
25
-
26
-
27
-
28
-
29
-
30
-
31
-
 32
32 -
 33
33 -
 34
34 -
 35
35 -
 36
36 -
 37
37 -
 38
38 -
 39
39 -
 40
40 -
 41
41 -
 42
42 -
 43
43 -
 44
44 -
 45
45 -
 46
46 -
 47
47 -
 48
48 -
 49
49 -
 50
50 -
 51
51 -
 52
52 -
53
-
54
-
55
-
56
-
57
-
58
-
59
-
60
-
61
-
62
-
63
-
64
-
65
-
66
-
67
-
68
-
69
-
70
-
71
-
72
-
73
-
74
-
75
-
76
-
77
-
78
-
79
-
80
-
81
-
82
-
83
-
84
-
85
-
86
-
87
-
88
-
89
-
90
-
91
-
92
-
93
-
94
-
95
-
96
-
97
-
98
-
99
-
100
-
101
-
102
-
103
-
104
-
105
-
106
 |
 |

22 TCF Financial Corporation and Subsidiaries
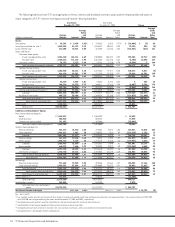
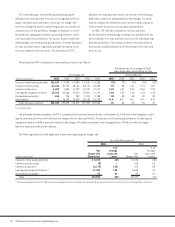
Fees and Service Charges Fees and service charges
decreased $12.5 million, or 4.6%, to $258.8 million for 2005,
compared with $271.3 million for 2004. This decrease primarily
reflects a decrease in deposit account service fees, attributable
to changing customer behavior and payment trends.
Card Revenue During 2005, card revenue, primarily interchange
fees, totaled $79.8 million, up 25.7%, from $63.5 million in 2004.
The increase in card revenue in 2005 was primarily attributed
to increased customer transaction volumes and related fees. The
continued success of TCF’s debit card program is dependent on the
success and viability of Visa and the continued use by customers
and acceptance by merchants of its debit and credit cards. See
“Item 1A. Risk Factors – Operational Risk Management” for further
discussion of Visa litigation.
ATM Revenue ATM revenue totaled $40.7 million for 2005, down
5.1% from $42.9 million in 2004. The decline in ATM revenue was
attributable to the continued decline in utilization of TCF’s ATM
machines by non-customers, TCF customers’ use of non-TCF ATM
machines and lower ATM revenues from TCF customers due to
deliberate TCF checking product modifications, partially offset by
the increased number of TCF customers with cards. These declines
resulted from increased use of debit cards as well as the increased
competition from other ATM networks. Additionally, as ATM site
contracts have been renewed, merchants have generally required
a larger percentage of the fee charged to non-customers for the
use of TCF’s ATM’s.
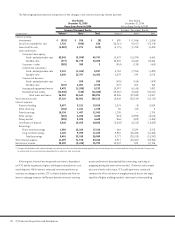
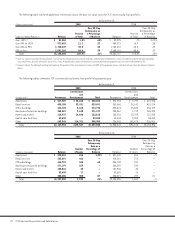
The following table presents the components of non-interest income:
Compound Annual
Year Ended December 31, Growth Rate
1-Year 5-Year
(Dollars in thousands) 2005 2004 2003 2002 2001 2005/2004 2005/2000
Fees and service charges $258,779 $271,259 $247,456 $226,051 $195,162 (4.6)% 9.2%
Card revenue 79,803 63,463 52,991 47,190 40,525 25.7 21.1
ATM revenue 40,730 42,935 43,623 45,296 45,768 (5.1) (3.0)
Investments and insurance revenue 10,665 12,558 13,901 15,848 11,554 (15.1) (2.8)
Subtotal 389,977 390,215 357,971 334,385 293,009 (.1) 8.7
Leasing and equipment finance 47,387 50,323 51,088 51,628 45,730 (5.8) 4.3
Mortgage banking 5,578 12,960 12,719 6,979 12,042 (57.0) (11.9)
Other 24,717 14,113 9,014 15,234 19,842 75.1 (4.2)
Fees and other revenue 467,659 467,611 430,792 408,226 370,623 –6.8
Gains on sales of securities
available for sale 10,671 22,600 32,832 11,536 863 (52.8) N.M.
Losses on termination of debt –– (44,345) – – –N.M.
Total non-interest income $478,330 $490,211 $419,279 $419,762 $371,486 (2.4) 7.3
Fees and other revenue as a
percentage of:
Total revenue 46.95% 47.61% 47.84% 44.42% 43.46%
Average assets 3.67 3.94 3.70 3.52 3.21
N.M. Not Meaningful.
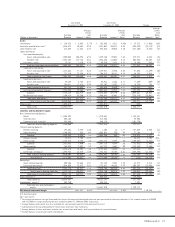
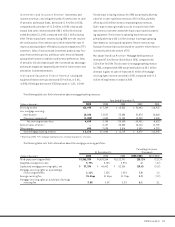
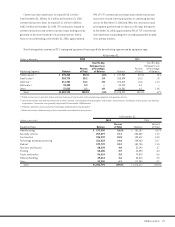
The following table sets forth information about TCF’s card business:
At or For the Year Ended December 31, Percentage Increase (Decrease)
(Dollars in thousands) 2005 2004 2003 2005/2004 2004/2003
Average number of checking accounts with a TCF card 1,406,728 1,323,877 1,193,936 6.3% 10.9%
Active card users 763,157 710,893 647,407 7.4 9.8
Average number of transactions per month 15.2 13.5 12.5 12.6 8.0
Sales volume for the year ended:
Off-line (Signature) $5,030,619 $4,197,678 $3,543,657 19.8 18.5
On-line (PIN) 642,446 537,124 355,045 19.6 51.3
Total $5,673,065 $4,734,802 $3,898,702 19.8 21.4
Percentage off-line 88.68% 88.66% 90.89% –(2.5)
Average off-line interchange rate 1.43% 1.40% 1.43% 2.1 (2.1)