TCF Bank 2005 Annual Report Download - page 82
Download and view the complete annual report
Please find page 82 of the 2005 TCF Bank annual report below. You can navigate through the pages in the report by either clicking on the pages listed below, or by using the keyword search tool below to find specific information within the annual report.-
 1
1 -
2
-
3
-
4
-
5
-
6
-
7
-
8
-
9
-
10
-
11
-
12
-
13
-
14
-
15
-
16
-
17
-
18
-
19
-
20
-
21
-
22
-
23
-
24
-
25
-
26
-
27
-
28
-
29
-
30
-
31
-
32
-
33
-
34
-
35
-
36
-
37
-
38
-
39
-
40
-
41
-
42
-
43
-
44
-
45
-
46
-
47
-
48
-
49
-
50
-
51
-
52
-
53
-
54
-
55
-
56
-
57
-
58
-
59
-
60
-
61
-
62
-
63
-
64
-
65
-
66
-
67
-
68
-
69
-
70
-
71
-
 72
72 -
 73
73 -
 74
74 -
 75
75 -
 76
76 -
 77
77 -
 78
78 -
 79
79 -
 80
80 -
 81
81 -
 82
82 -
 83
83 -
 84
84 -
 85
85 -
 86
86 -
 87
87 -
 88
88 -
 89
89 -
 90
90 -
 91
91 -
 92
92 -
93
-
94
-
95
-
96
-
97
-
98
-
99
-
100
-
101
-
102
-
103
-
104
-
105
-
106
 |
 |

62 TCF Financial Corporation and Subsidiaries
The assets of TCF’s pension plan assets are invested in passively
managed index mutual funds that are designed to track the per-
formance of the Standard and Poor’s 500 and the Morgan Stanley
Capital International U.S. Mid-Cap 450 indexes, at targeted
weightings of 75% and 25%, respectively. Prior to December 2004,
the assets were managed by external investment managers on a
discretionary basis subject to certain restrictions and limitations.
The actuarial assumptions used in the pension plan valuation
are reviewed annually. The expected long-term rate of return
on plan assets is determined by reference to historical market
returns and future expectations. The weighted-average 10-year
return of the indexes underlying the Plan’s current investment
strategy was 9.3%, net of administrative expenses. Although
past performance is no guarantee of the future results, TCF is
not aware of any reasons why it should not be able to achieve the
assumed future average annual returns of 8.75%, net of adminis-
trative expenses, on plan assets over complete market cycles. A
1% difference in the expected return on plan assets would result
in a $596 thousand change in net periodic pension expense.
The discount rate used to determine TCF’s pension and post-
retirement benefit obligations as of December 31, 2005 was
determined by matching estimated benefit cash flows to a yield
curve composed of corporate bonds rated AA by Moody’s. Bonds
which are callable and putable were excluded. The average esti-
mated duration of TCF’s pension and postretirement plans was
approximately eight years. In prior years, the discount rate was
determined based on the Moody’s AA and Citigroup Pension Liability
long-term bond indexes.
The actual return on plan assets, net of administrative
expenses, was 11.5% for 2005 and 9.3% for 2004. These results
decreased the actuarial loss by $1.7 million in 2005 and increased
the actuarial loss by $90 thousand in 2004. The decrease in the
discount rate assumption to 5.25% at December 31, 2005 from
6.0% at December 31, 2004 resulted in a $3.1 million increase in
the actuarial loss in 2005. These changes had no impact on net
income for 2005. The increase in the actuarial loss in 2004 was
primarily due to various plan participant census changes,
partially offset by a decrease in the compensation increase
assumption to 4.0% from 4.5%.
TCF currently does not expect to contribute to the Pension Plan
in 2006. TCF expects to contribute approximately $863 thousand to
the Postretirement Plan in 2006. TCF currently has no plans to pre-
fund the Postretirement Plan in 2006.
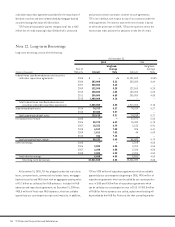
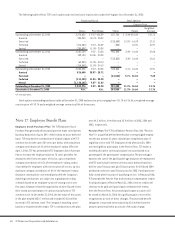
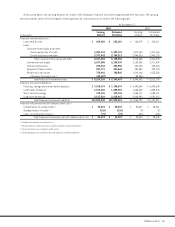
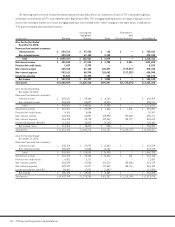
Net periodic benefit cost included in compensation and employee benefits expense consists of the following:
Pension Plan Postretirement Plan
Year Ended December 31, Year Ended December 31,
(In thousands) 2005 2004 2003 2005 2004 2003
Service cost $ 5,303 $ 4,632 $ 3,950 $35 $ 53 $ 60
Interest cost 3,428 3,164 2,950 552 672 740
Expected return on plan assets (5,727) (5,955) (6,374) –––
Amortization of transition obligation –––131 210 210
Amortization of prior service cost (249) (233) (361) –––
Recognized actuarial loss 1,050 ––139 215 226
Net periodic benefit cost $ 3,805 $ 1,608 $ 165 $857 $1,150 $1,236
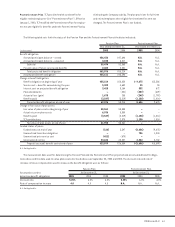
The discount rate, the expected long-term rate of return on plan assets and the rate of increase in future compensation used to deter-
mine the net benefit cost were as follows:
Pension Plan Postretirement Plan
Assumptions used to Year Ended December 31, Year Ended December 31,
determine net benefit cost 2005 2004 2003 2005 2004 2003
Discount rate 6.0% 6.0% 6.5% 6.0% 6.0% 6.5%
Expected long-term rate of return
on plan assets(1) 8.75 8.5 8.5 N.A. N.A. N.A.
Rate of compensation increase 4.0 4.5 4.5 N.A. N.A. N.A.
(1) Net of administrative expenses for 2004 and 2003.
N.A. Not Applicable.