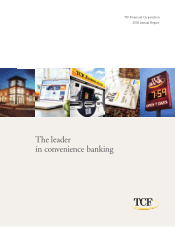
TCF Bank 2005 Annual Report Download - page 2
Download and view the complete annual report
Please find page 2 of the 2005 TCF Bank annual report below. You can navigate through the pages in the report by either clicking on the pages listed below, or by using the keyword search tool below to find specific information within the annual report.-
 1
1 -
 2
2 -
 3
3 -
 4
4 -
 5
5 -
 6
6 -
 7
7 -
 8
8 -
 9
9 -
 10
10 -
 11
11 -
 12
12 -
 13
13 -
14
-
15
-
16
-
17
-
18
-
19
-
20
-
21
-
22
-
23
-
24
-
25
-
26
-
27
-
28
-
29
-
30
-
31
-
32
-
33
-
34
-
35
-
36
-
37
-
38
-
39
-
40
-
41
-
42
-
43
-
44
-
45
-
46
-
47
-
48
-
49
-
50
-
51
-
52
-
53
-
54
-
55
-
56
-
57
-
58
-
59
-
60
-
61
-
62
-
63
-
64
-
65
-
66
-
67
-
68
-
69
-
70
-
71
-
72
-
73
-
74
-
75
-
76
-
77
-
78
-
79
-
80
-
81
-
82
-
83
-
84
-
85
-
86
-
87
-
88
-
89
-
90
-
91
-
92
-
93
-
94
-
95
-
96
-
97
-
98
-
99
-
100
-
101
-
102
-
103
-
104
-
105
-
106
 |
 |

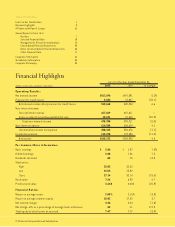
At or For the Year Ended December 31,
(Dollars in thousands, except per-share data) 2005 2004 % Change
Operating Results:
Net interest income $517,690 $491,891 5.2%
Provision for credit losses 5,022 10,947 (54.1)
Net interest income after provision for credit losses 512,668 480,944 6.6
Non-interest income:
Fees and other revenue 467,659 467,611 –
Gains on sales of securities available for sale 10,671 22,600 (52.8)
Total non-interest income 478,330 490,211 (2.4)
Non-interest expense 610,588 586,679 4.1
Income before income tax expense 380,410 384,476 (1.1)
Income tax expense 115,278 129,483 (11.0)
Net income $265,132 $254,993 4.0
Per Common Share Information:
Basic earnings $ 2.00 $ 1.87 7.0%
Diluted earnings 2.00 1.86 7.5
Dividends declared .85 .75 13.3
Stock price:
High 32.03 32.62
Low 24.55 23.92
Close 27.14 32.14 (15.6)
Book value 7.46 6.99 6.7
Price to book value 3.64 X 4.60 X (20.9)
Financial Ratios:
Return on average assets 2.08% 2.15% (3.3)
Return on average common equity 28.03 27.02 3.7
Net interest margin 4.46 4.54 (1.8)
Net charge-offs as a percentage of average loans and leases .25 .11 127.3
Total equity to total assets at year end 7.47 7.77 (3.9)
Financial Highlights
Table of Contents
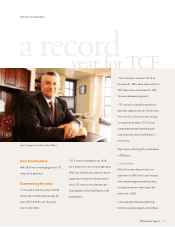
Letter to Our Stockholders 1
Business Highlights 8
A Tribute to William A. Cooper 15
Annual Report on Form 10-K
Business 1
Selected Financial Data 14
Management’s Discussion and Analysis 15
Consolidated Financial Statements 42
Notes to Consolidated Financial Statements 46
Other Financial Data 71
Corporate Information 81
Stockholder Information 83
Corporate Philosophy 85
TCF Financial Corporation and Subsidiaries