TCF Bank 2005 Annual Report Download - page 48
Download and view the complete annual report
Please find page 48 of the 2005 TCF Bank annual report below. You can navigate through the pages in the report by either clicking on the pages listed below, or by using the keyword search tool below to find specific information within the annual report.-
 1
1 -
2
-
3
-
4
-
5
-
6
-
7
-
8
-
9
-
10
-
11
-
12
-
13
-
14
-
15
-
16
-
17
-
18
-
19
-
20
-
21
-
22
-
23
-
24
-
25
-
26
-
27
-
28
-
29
-
30
-
31
-
32
-
33
-
34
-
35
-
36
-
37
-
 38
38 -
 39
39 -
 40
40 -
 41
41 -
 42
42 -
 43
43 -
 44
44 -
 45
45 -
 46
46 -
 47
47 -
 48
48 -
 49
49 -
 50
50 -
 51
51 -
 52
52 -
 53
53 -
 54
54 -
 55
55 -
 56
56 -
 57
57 -
 58
58 -
59
-
60
-
61
-
62
-
63
-
64
-
65
-
66
-
67
-
68
-
69
-
70
-
71
-
72
-
73
-
74
-
75
-
76
-
77
-
78
-
79
-
80
-
81
-
82
-
83
-
84
-
85
-
86
-
87
-
88
-
89
-
90
-
91
-
92
-
93
-
94
-
95
-
96
-
97
-
98
-
99
-
100
-
101
-
102
-
103
-
104
-
105
-
106
 |
 |

28 TCF Financial Corporation and Subsidiaries
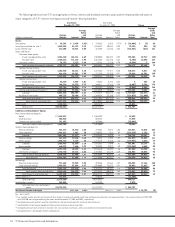
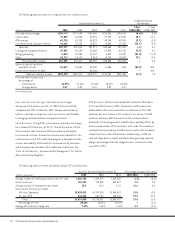
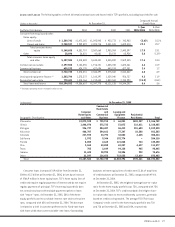
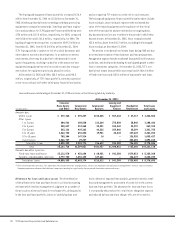
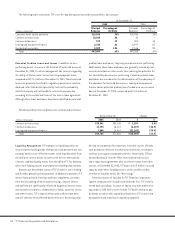
The following tables summarize TCF’s commercial real estate loan portfolio by property type:
At December 31,
2005 2004
Construction Construction
and and
(In thousands) Permanent Development Total Permanent Development Total
Apartments $ 517,989 $ 10,065 $ 528,054 $ 524,253 $ 2,795 $ 527,048
Retail services 490,100 33,591 523,691 382,068 28,142 410,210
Office buildings 411,128 3,665 414,793 420,874 35,865 456,739
Warehouse/industrial buildings 268,562 2,635 271,197 258,561 1,729 260,290
Hotels and motels 110,975 14,840 125,815 122,236 15,700 137,936
Health care facilities 53,650 – 53,650 44,344 9,308 53,652
Other 265,549 114,751 380,300 206,042 102,479 308,521
Total $2,117,953 $179,547 $2,297,500 $1,958,378 $196,018 $2,154,396
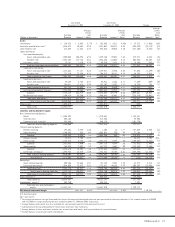
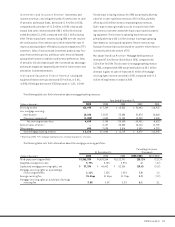
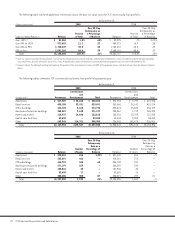
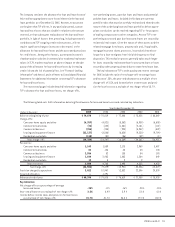
At December 31,
2005 2004
Over 30-Day Over 30-Day
Delinquency Delinquency
Rate as a Rate as a
Number Percentage of Number Percentage of
(Dollars in thousands) Balance of Loans Balance Balance of Loans Balance
Apartments $ 528,054 636 1.32% $ 527,048 650 –%
Retail services 523,691 426 – 410,210 375 –
Office buildings 414,793 260 .68 456,739 241 –
Warehouse/industrial buildings 271,197 259 – 260,290 243 –
Hotels and motels 125,815 35 – 137,936 35 –
Health care facilities 53,650 17 – 53,652 26 –
Other 380,300 300 .07 308,521 292 .01
Total $2,297,500 1,933 .44% $2,154,396 1,862 –%
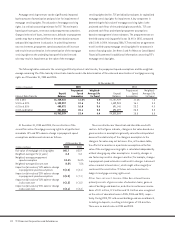
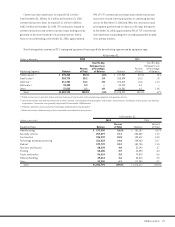
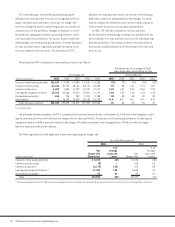
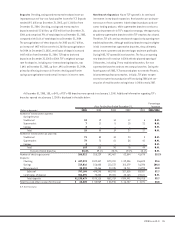
The following table sets forth additional information about the loan-to-value ratios for TCF’s home equity loan portfolio:
At December 31,
(Dollars in thousands) 2005 2004
Over 30-Day Over 30-Day
Delinquency as Delinquency as
Percent a Percentage Percent a Percentage
Loan-to-Value Ratios (1) Balance of Total of Balance Balance of Total of Balance
Over 100% (2) $ 51,004 1.0% .60% $ 32,825 .7% 3.02%
Over 90% to 100% 571,469 11.1 .37 449,291 10.3 .38
Over 80% to 90% 1,725,049 33.5 .35 1,750,531 40.0 .32
80% or less 2,801,166 54.4 .35 2,149,110 49.0 .32
Total $5,148,688 100.0% .36% $4,381,757 100.0% .35%
(1) Loan-to-value is based on the loan amount (current outstanding balance on closed-end loans and the total commitment on lines of credit) plus deferred loan origination
costs net of fees, plus the amount of senior liens, if any. Property values represent the most recent market value or property tax assessment value known to TCF.
(2) Amount reflects the total outstanding loan balance. The portion of the loan balance in excess of 100% of the property value is substantially less than the amount included
above.