TCF Bank 2005 Annual Report Download - page 46
Download and view the complete annual report
Please find page 46 of the 2005 TCF Bank annual report below. You can navigate through the pages in the report by either clicking on the pages listed below, or by using the keyword search tool below to find specific information within the annual report.-
 1
1 -
2
-
3
-
4
-
5
-
6
-
7
-
8
-
9
-
10
-
11
-
12
-
13
-
14
-
15
-
16
-
17
-
18
-
19
-
20
-
21
-
22
-
23
-
24
-
25
-
26
-
27
-
28
-
29
-
30
-
31
-
32
-
33
-
34
-
35
-
 36
36 -
 37
37 -
 38
38 -
 39
39 -
 40
40 -
 41
41 -
 42
42 -
 43
43 -
 44
44 -
 45
45 -
 46
46 -
 47
47 -
 48
48 -
 49
49 -
 50
50 -
 51
51 -
 52
52 -
 53
53 -
 54
54 -
 55
55 -
 56
56 -
57
-
58
-
59
-
60
-
61
-
62
-
63
-
64
-
65
-
66
-
67
-
68
-
69
-
70
-
71
-
72
-
73
-
74
-
75
-
76
-
77
-
78
-
79
-
80
-
81
-
82
-
83
-
84
-
85
-
86
-
87
-
88
-
89
-
90
-
91
-
92
-
93
-
94
-
95
-
96
-
97
-
98
-
99
-
100
-
101
-
102
-
103
-
104
-
105
-
106
 |
 |

26 TCF Financial Corporation and Subsidiaries
$3.8 million in 2004 as a result of increased customer transaction
activity. See Note 1 of Notes to Consolidated Financial Statements
for additional information concerning deposit account losses.
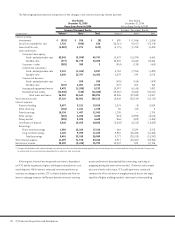
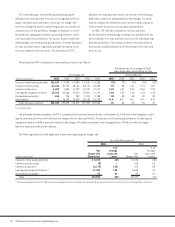
Other Non-Interest Expense Other non-interest expense
increased $14.4 million, or 12.1%, in 2005, primarily due to
increases in card processing and issuance expenses related to the
overall increase in card volumes and increases in net real estate
expense as a result of net recoveries on sales of foreclosed
properties in 2004. In 2004, non-interest expense decreased
$5 million, or 4%, primarily attributable to net real estate
expense, which decreased $3.1 million, driven by $3.4 million of
net recoveries on sales of foreclosed properties and a decrease
in mortgage banking expenses of $2 million due to the decline in
refinance activity and the previously discussed restructuring of
the mortgage banking business. In 2003, other non-interest
expense increased $3.8 million, or 3.1%, primarily due to higher
levels of mortgage banking production and prepayment activity.
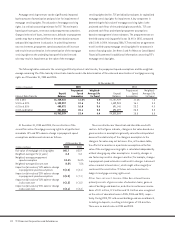
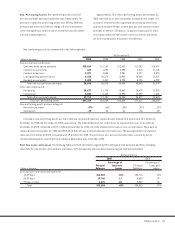
Income Taxes Income tax expense represented 30.30% of income
before income tax expense during 2005, compared with 33.68%
and 34.14% in 2004 and 2003, respectively. The lower effective
income tax rate in 2005 was primarily due to the closing of certain
previous years’ tax returns, clarification of existing state tax
legislation and developments in income tax audits. The lower
effective tax rate in 2004 compared with 2003 primarily reflects
increases in investments in tax-advantaged affordable housing
limited partnerships and lower state income taxes.
TCF has a Real Estate Investment Trust (“REIT”) and a related
foreign operating company (“FOC”) that acquire, hold and man-
age real estate loans and other assets. These companies are
consolidated with TCF Bank and are therefore included in the
consolidated financial statements of TCF Financial Corporation.
The REIT and related companies must meet specific provisions of
the Internal Revenue Code and state tax laws. If these companies
fail to meet any of the required provisions of federal and state
tax laws, TCF’s tax expense could increase. TCF’s FOC operates
under laws in certain states (including Minnesota and Illinois)
that allow deductions for income derived from FOCs. Use of these
companies is and has been the subject of federal and state audits.
The determination of current and deferred income taxes is a
critical accounting estimate which is based on complex analyses
of many factors including interpretation of federal and state
income tax laws, the differences between the tax and financial
reporting bases of assets and liabilities (temporary differences),
estimates of amounts due or owed such as the timing of reversal
of temporary differences and current financial accounting stan-
dards. Additionally, there can be no assurances that estimates
and interpretations used in determining income tax liabilities
may not be challenged by federal and state taxing authorities.
Actual results could differ significantly from the estimates and
income tax law interpretations used in determining the current
and deferred income tax liabilities. In addition, under generally
accepted accounting principles, deferred income tax assets
and liabilities are recorded at the current prevailing federal and
state income tax rates. If such rates change, deferred income
tax assets and liabilities must be adjusted in the period of
change through a charge or credit to income tax expense.
Further detail on income taxes is provided in Note 13 of Notes
to Consolidated Financial Statements.
Consolidated Financial Condition Analysis
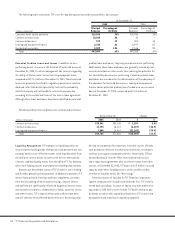
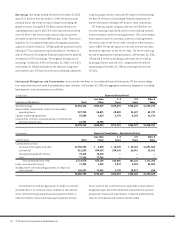
Securities Available for Sale Securities available for sale
increased $28.7 million to $1.6 billion at December 31, 2005. This
increase reflects purchases of $1.3 billion of mortgage-backed
securities, partially offset by sales of $1 billion of mortgage-backed
securities, in which the company recognized $10.7 million in gains,
and normal payment and prepayment activity. At December 31,
2005, the increase in mortgage-backed securities partially offsets
the declines in residential loans in the treasury services portfolio.
TCF’s securities available for sale portfolio included $1.6 billion
and $5.3 million of fixed-rate and adjustable-rate mortgage-
backed securities, respectively. Net unrealized losses on securities
available for sale totaled $33.2 million at December 31, 2005,
compared with net unrealized losses of $2.2 million at December
31, 2004. TCF may, from time to time, sell mortgage-backed
securities and utilize the proceeds to either reduce borrowings
or fund growth in loans and leases.