Boeing 2006 Annual Report Download - page 61
Download and view the complete annual report
Please find page 61 of the 2006 Boeing annual report below. You can navigate through the pages in the report by either clicking on the pages listed below, or by using the keyword search tool below to find specific information within the annual report.-
 1
1 -
2
-
3
-
4
-
5
-
6
-
7
-
8
-
9
-
10
-
11
-
12
-
13
-
14
-
15
-
16
-
17
-
18
-
19
-
20
-
21
-
22
-
23
-
24
-
25
-
26
-
27
-
28
-
29
-
30
-
31
-
32
-
33
-
34
-
35
-
36
-
37
-
38
-
39
-
40
-
41
-
42
-
43
-
44
-
45
-
46
-
47
-
48
-
49
-
50
-
 51
51 -
 52
52 -
 53
53 -
 54
54 -
 55
55 -
 56
56 -
 57
57 -
 58
58 -
 59
59 -
 60
60 -
 61
61 -
 62
62 -
 63
63 -
 64
64 -
 65
65 -
 66
66 -
 67
67 -
 68
68 -
 69
69 -
 70
70 -
 71
71 -
72
-
73
-
74
-
75
-
76
-
77
-
78
-
79
-
80
-
81
-
82
-
83
-
84
-
85
-
86
-
87
-
88
-
89
-
90
-
91
-
92
-
93
-
94
-
95
-
96
 |
 |

The Boeing Company and Subsidiaries 59
Notes to Consolidated Financial Statements
accounted for $349 and $494 of aircraft financing. The bank-
ruptcy, including the impact of any restructurings, related to
Northwest is not expected to have a material adverse impact
on our earnings, cash flows and/or financial position. Although
certain other customers have requested a restructuring of
their transactions, we do not believe that they would have a
material adverse effect on our earnings, cash flows and/or
financial position.
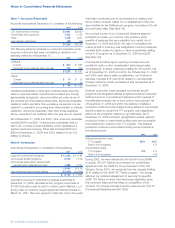
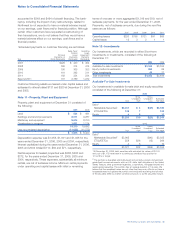
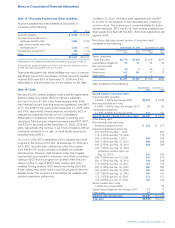
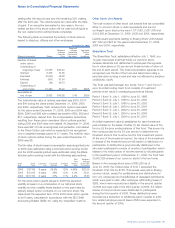
Scheduled payments on customer financing are as follows:
Sales-Type/ Operating
Finance Lease
Principal Lease Equipment
Payments on Payments Payments
Year Notes Receivable Receivable Receivable
2007 $225 $«««440 $«««454
2008 360 314 414
2009 150 305 353
2010 161 292 311
2011 182 334 234
Beyond 2011 737 2,789 1,232
Customer financing assets we leased under capital leases and
subleased to others totaled $137 and $200 at December 31, 2006
and 2005.
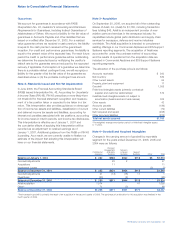
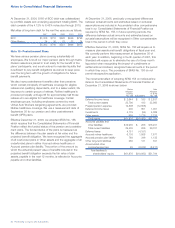
Note 11 – Property, Plant and Equipment
Property, plant and equipment at December 31 consisted of
the following:
2006 2005
Land $««««««524 $««««««481
Buildings and land improvements 8,571 9,287
Machinery and equipment 8,614 8,750
Construction in progress 1,601 1,174
19,310 19,692
Less accumulated depreciation (11,635)(11,272)
$«««7,675 $«««8,420
Depreciation expense was $1,058, $1,001 and $1,028 for the
years ended December 31, 2006, 2005 and 2004, respectively.
Interest capitalized during the years ended December 31, 2006,
2005 and 2004 totaled $110, $84 and $71, respectively.
Rental expense for leased properties was $388, $400 and
$372, for the years ended December 31, 2006, 2005 and
2004, respectively. These expenses, substantially all minimum
rentals, are net of sublease income. Minimum rental payments
under operating and capital leases with initial or remaining
terms of one year or more aggregated $1,019 and $19, net of
sublease payments, for the year ended December 31, 2006.
Payments, net of sublease amounts, due during the next five
years are as follows:
2007 2008 2009 2010 2011
Operating leases $220 $165 $121 $91 $66
Capital leases 123211
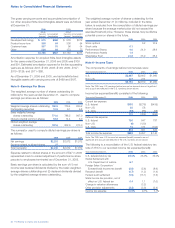
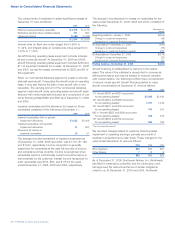
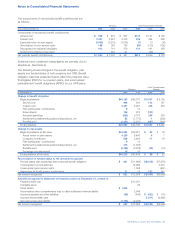
Note 12 – Investments
Our investments, which are recorded in either Short-term
investments or Investments, consisted of the following at
December 31:
2006 2005
Available-for-sale investments $3,344 $3,304
Equity method investments 964 65
Other investments 45 37
Total investments $4,353 $3,406
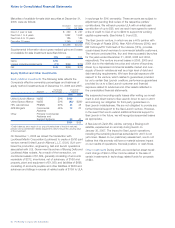
Available-For-Sale Investments
Our investments in available-for-sale debt and equity securities
consisted of the following at December 31:
2006
Gross Gross
Unrealized Unrealized Estimated
Cost Gain Loss Fair Value
Debt:1
Marketable Securities2$3,201 $««4 $(25)$3,180
ETCs/EETCs 145 7 152
Equity 48 12
$3,350 $19 $(25)$3,344
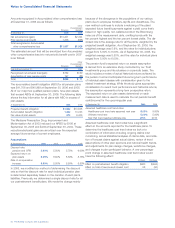
2005
Gross Gross
Unrealized Unrealized Estimated
Cost Gain Loss Fair Value
Debt:1
Marketable Securities2$3,065 $(40) $3,025
ETCs/EETCs 258 $26 (15) 269
Equity 4 6 10
$3,327 $32 $(55) $3,304
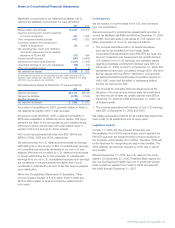
1At December 31, 2006, debt securities with estimated fair values of $1,151
and cost of $1,172 have been in a continuous unrealized loss position for
12 months or longer.
2The portfolio is diversified and highly liquid and primarily consists of investment
grade fixed income instruments such as U.S. dollar debt obligations of the United
States Treasury, other government agencies, corporations, mortgage-backed and
asset-backed securities. The portfolio has an average duration of 1.6 years. We
believe that the unrealized losses are not other-than-temporary. We do not have a
foreseeable need to liquidate the portfolio and anticipate recovering the full value
of the securities either as market conditions improve, or as the securities mature.