Boeing 2006 Annual Report Download - page 32
Download and view the complete annual report
Please find page 32 of the 2006 Boeing annual report below. You can navigate through the pages in the report by either clicking on the pages listed below, or by using the keyword search tool below to find specific information within the annual report.-
 1
1 -
2
-
3
-
4
-
5
-
6
-
7
-
8
-
9
-
10
-
11
-
12
-
13
-
14
-
15
-
16
-
17
-
18
-
19
-
20
-
21
-
 22
22 -
 23
23 -
 24
24 -
 25
25 -
 26
26 -
 27
27 -
 28
28 -
 29
29 -
 30
30 -
 31
31 -
 32
32 -
 33
33 -
 34
34 -
 35
35 -
 36
36 -
 37
37 -
 38
38 -
 39
39 -
 40
40 -
 41
41 -
 42
42 -
43
-
44
-
45
-
46
-
47
-
48
-
49
-
50
-
51
-
52
-
53
-
54
-
55
-
56
-
57
-
58
-
59
-
60
-
61
-
62
-
63
-
64
-
65
-
66
-
67
-
68
-
69
-
70
-
71
-
72
-
73
-
74
-
75
-
76
-
77
-
78
-
79
-
80
-
81
-
82
-
83
-
84
-
85
-
86
-
87
-
88
-
89
-
90
-
91
-
92
-
93
-
94
-
95
-
96
 |
 |

sources, our orders might be structured as annual follow-on
contracts, or as one large multi-year order or long-term award.
As a result, period-to-period comparisons of backlog are not
necessarily indicative of future workloads. The following discus-
sions of comparative results among periods should be viewed
in this context.
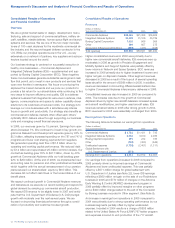
Revenues IDS revenues increased 4% in 2006 and 1% in 2005
as growth in both PE&MS and Support Systems was partially
offset by lower volume in N&SS.
Operating Earnings IDS operating earnings decreased by
$887 million in 2006 from 2005 reflecting a $569 million net
gain on the sale of Rocketdyne in 2005 and $770 million of
charges on the AEW&C development program in 2006 partially
offset by improved margins on other programs. Operating earn-
ings increased by $983 million in 2005 from 2004 primarily due
to the net gain on the Rocketdyne sale in 2005 in addition to
stable performance in the commercial satellite business com-
pared to 2004, when losses were recorded resulting from cost
growth due to technical and quality issues and write-downs of
slow-moving inventory.
Backlog Total backlog is comprised of contractual backlog,
which represents work we are on contract to perform for which
we have received funding, and unobligated backlog, which
represents work we are on contract to perform for which fund-
ing has not yet been authorized and appropriated. IDS total
backlog decreased 6% in 2006, from $80,513 million to
$75,715 million, primarily due to decreases in unobligated
backlog of $10,584 million which resulted from funding released
from new orders and existing contracts on F/A-18, FCS, C-17,
and Proprietary, offset by increases in contractual backlog of
$5,786 million which were driven by funding received from new
orders and existing contracts for C-17, F/A-18, Integrated
Logistics Chinook support, and Proprietary.
For further details on the changes between periods, refer to
the discussions of the individual segments below.
Additional Considerations
Our business includes a variety of development programs
which have complex design and technical challenges. Many of
these programs have cost-type contracting arrangements. In
these cases, the associated financial risks are primarily in lower
profit rates or program cancellation if milestones and technical
progress are not accomplished. Examples of these programs
include Ground-based Midcourse Defense (GMD), FCS, P-8A
(P-8A, formerly Multi-mission Maritime Aircraft), Proprietary pro-
grams, Airborne Laser, Joint Tactical Radio System (JTRS),
Family of Beyond Line-of-Sight Terminals, and the E/A-18G.
Some of our development programs are contracted on a
fixed-price basis. Many of these programs have highly complex
designs. As technical or quality issues arise, we may experi-
ence schedule delays and cost impacts, which could increase
our estimated cost to perform the work or reduce our esti-
mated price, either of which could result in a material charge.
These programs are ongoing, and while we believe the cost
and fee estimates incorporated in the financial statements are
appropriate, the technical complexity of these programs creates
financial risk as additional completion costs may become
necessary or scheduled delivery dates could be missed, which
could trigger termination-for-default provisions, the loss of
satellite on-orbit incentive payments, or other financially signifi-
cant exposure. These programs have risk for reach-forward
losses if our estimated costs exceed our estimated contract
revenues. Examples of these programs include AEW&C,
767 Tanker, commercial and military satellites, Vigilare and
High Frequency Modernisation.
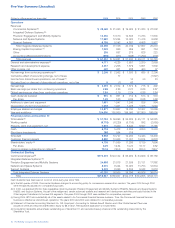
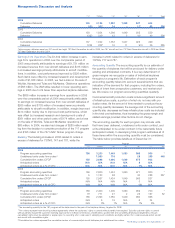
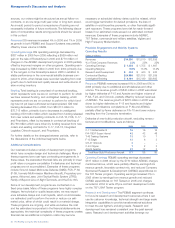
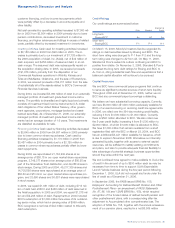
Precision Engagement and Mobility Systems
Operating Results
(Dollars in millions) 2006 2005 2004
Revenues $14,350 $13,510 $12,835
% of Total Company Revenues 23%25%25%
Operating Earnings $÷1,238 $÷1,755 $÷1,697
Operating Margins 8.6%13.0%13.2%
Research and Development $÷÷«404 $÷÷«440 $÷÷«420
Contractual Backlog $24,988 $21,815 $21,539
Unobligated Backlog $÷9,194 $15,189 $20,885
Revenues PE&MS revenues increased 6% in 2006 and 5% in
2005 primarily due to additional aircraft deliveries and other
volume. The revenue growth of $840 million in 2006 was driven
by higher deliveries of F-15 and Apache and higher volume of
P-8A, F-22, and Chinook, partially offset by reduced revenues
of AEW&C. The revenue growth of $675 million in 2005 was
driven by higher deliveries on F-15 and Apache and higher
volume and milestone completions on P-8A and AEW&C,
partially offset by fewer deliveries on F/A-18 and lower volume
resulting from the Comanche termination.
Deliveries of new-build production aircraft, excluding remanu-
factures and modifications, were as follows:
2006 2005 2004
C-17 Globemaster III 16 16 16
F/A-18E/F Super Hornet 42 42 48
T-45 Training Systems 13 10 7
F-15 Eagle 12 63
CH-47 Chinook 2––
C-40 Clipper 123
AH-64 Apache 31 12 3
Total New-Build Production Aircraft 117 88 80
Operating Earnings PE&MS operating earnings decreased
$517 million in 2006 driven by the $770 million AEW&C charges
mentioned above, which were partially offset by earnings from
revenue growth, favorable contract mix, and reduced Company
Sponsored Research & Development (CSR&D) expenditures on
the 767 Tanker program. Operating earnings increased 3% in
2005 driven by earnings from revenue growth and reduced
CSR&D expenditures on 767 Tankers in 2005 and charges
recorded in 2004 to write off pre-contract development costs
on the 767 USAF Tanker program.
Research and Development The PE&MS segment continues
to focus its research and development resources where it can
use its customer knowledge, technical strength and large-scale
integration capabilities to provide transformational solutions
to meet the war fighter’s enduring needs. Research and
development has remained consistent over the past several
years. Research and development activities leverage our
30 The Boeing Company and Subsidiaries
Management’s Discussion and Analysis