Boeing 2006 Annual Report Download - page 56
Download and view the complete annual report
Please find page 56 of the 2006 Boeing annual report below. You can navigate through the pages in the report by either clicking on the pages listed below, or by using the keyword search tool below to find specific information within the annual report.-
 1
1 -
2
-
3
-
4
-
5
-
6
-
7
-
8
-
9
-
10
-
11
-
12
-
13
-
14
-
15
-
16
-
17
-
18
-
19
-
20
-
21
-
22
-
23
-
24
-
25
-
26
-
27
-
28
-
29
-
30
-
31
-
32
-
33
-
34
-
35
-
36
-
37
-
38
-
39
-
40
-
41
-
42
-
43
-
44
-
45
-
 46
46 -
 47
47 -
 48
48 -
 49
49 -
 50
50 -
 51
51 -
 52
52 -
 53
53 -
 54
54 -
 55
55 -
 56
56 -
 57
57 -
 58
58 -
 59
59 -
 60
60 -
 61
61 -
 62
62 -
 63
63 -
 64
64 -
 65
65 -
 66
66 -
67
-
68
-
69
-
70
-
71
-
72
-
73
-
74
-
75
-
76
-
77
-
78
-
79
-
80
-
81
-
82
-
83
-
84
-
85
-
86
-
87
-
88
-
89
-
90
-
91
-
92
-
93
-
94
-
95
-
96
 |
 |

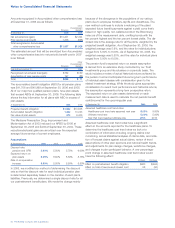
54 The Boeing Company and Subsidiaries
Notes to Consolidated Financial Statements
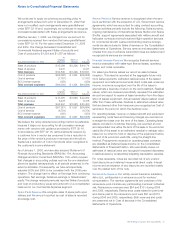
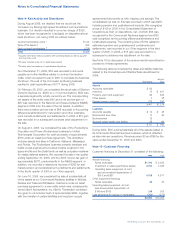
The gross carrying amounts and accumulated amortization of
our other acquired finite-lived intangible assets were as follows
at December 31:
2006 2005
Gross Gross
Carrying Accumulated Carrying Accumulated
Amount Amortization Amount Amortization
Developed technology $«««615 $369 $«««576 $312
Product know-how 308 64 308 54
Customer base 307 51 96 34
Other 536 83 173 75
$1,766 $567 $1,153 $475
Amortization expense for acquired finite-lived intangible assets
for the years ended December 31, 2006 and 2005 was $100
and $91. Estimated amortization expense for the five succeeding
years are as follows: 2007–$148; 2008–$148; 2009–$147;
2010– $129; and 2011– $86.
As of December 31, 2006 and 2005, we had indefinite-lived
intangible assets with carrying amounts of $499 and $197.
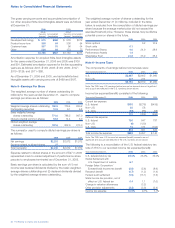
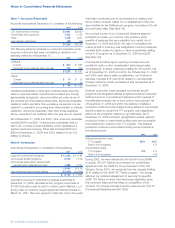
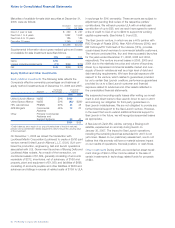
Note 5 – Earnings Per Share
The weighted average number of shares outstanding (in
millions) for the years ended December 31, used to compute
earnings per share are as follows:
2006 2005 2004
Weighted average shares outstanding 760.5 779.4 800.2
Participating securities 10.5 9.1 6.8
Basic weighted average
shares outstanding 771.0 788.5 807.0
Diluted potential common shares 16.6 14.4 6.0
Diluted weighted average
shares outstanding 787.6 802.9 813.0
The numerator used to compute diluted earnings per share is
as follows:
2006 2005 2004
Net earnings $2,215 $2,572 $1,872
Expense related to diluted shares 27
Total numerator $2,242 $2,572 $1,872
Expense related to diluted shares in the amount of $27 in 2006
represented mark-to-market adjustment of performance share
payouts to employees terminated as of December 31, 2005.
Basic earnings per share is calculated by the sum of (1) net
income less declared dividends divided by the basic weighted-
average shares outstanding and (2) declared dividends divided
by the weighted average shares outstanding.
The weighted average number of shares outstanding for the
year ended December 31 (in millions), included in the table
below, is excluded from the computation of diluted earnings per
share because the average market price did not exceed the
exercise/threshold price. However, these shares may be dilutive
potential common shares in the future.
2006 2005 2004
Stock options 0.2 10.9
Stock units 0.1
Performance Shares 4.0 24.9 28.6
Performance Awards 1.4
ShareValue Trust 24.6 33.9 38.4
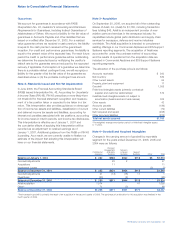
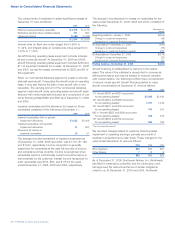
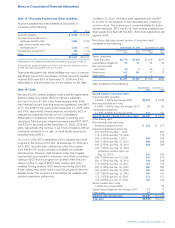
Note 6 – Income Taxes
The components of earnings before income taxes were:
Year ended December 31, 2006 2005 2004
U.S. $3,067 $2,605 $1,960
Non-U.S. 127 214
$3,194 $2,819 $1,960
Note: The 2004 non-U.S. earnings before income tax amounts are not significant
and as such are reflected in the U.S. numbers shown above.
Income tax expense/(benefit) consisted of the following:
Year ended December 31, 2006 2005 2004
Current tax expense
U.S. federal $193 $(276)$(435)
Non-U.S. 35 58
U.S. state (58)(86)(58)
170 (304)(493)
Deferred tax expense
U.S. federal 750 547 787
Non-U.S. (6)(120)
U.S. state 74 134 (154)
818 561 633
Total income tax expense $988 $«257 $«140
Note: The 2004 non-U.S. income tax expense/(benefit) amounts are not
significant and as such are reflected in the U.S. numbers shown above.
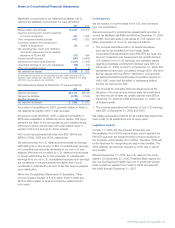
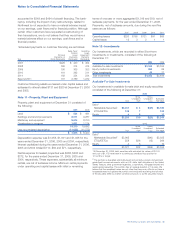
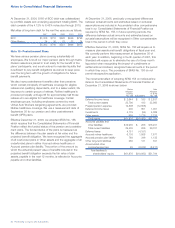
The following is a reconciliation of the U.S. federal statutory tax
rate of 35% to our recorded income tax expense/(benefit):
Year ended December 31, 2006 2005 2004
U.S. federal statutory tax 35.0%35.0%35.0%
Global Settlement with
U.S. Department of Justice 6.7
Foreign Sales Corporation/
Extraterritorial Income tax benefit (5.8)(5.6)(8.6)
Research benefit (0.7)(1.2)(1.4)
Federal audit settlement (1.5)(13.1)(7.5)
State income tax provision, net of
effect on U.S. federal tax 0.4 1.1 (7.0)
Change in valuation allowances (3.2)
Other provision adjustments (3.2)(3.9)(3.4)
Income tax expense 30.9%9.1%7.1%