Boeing 2006 Annual Report Download - page 27
Download and view the complete annual report
Please find page 27 of the 2006 Boeing annual report below. You can navigate through the pages in the report by either clicking on the pages listed below, or by using the keyword search tool below to find specific information within the annual report.-
 1
1 -
2
-
3
-
4
-
5
-
6
-
7
-
8
-
9
-
10
-
11
-
12
-
13
-
14
-
15
-
16
-
 17
17 -
 18
18 -
 19
19 -
 20
20 -
 21
21 -
 22
22 -
 23
23 -
 24
24 -
 25
25 -
 26
26 -
 27
27 -
 28
28 -
 29
29 -
 30
30 -
 31
31 -
 32
32 -
 33
33 -
 34
34 -
 35
35 -
 36
36 -
 37
37 -
38
-
39
-
40
-
41
-
42
-
43
-
44
-
45
-
46
-
47
-
48
-
49
-
50
-
51
-
52
-
53
-
54
-
55
-
56
-
57
-
58
-
59
-
60
-
61
-
62
-
63
-
64
-
65
-
66
-
67
-
68
-
69
-
70
-
71
-
72
-
73
-
74
-
75
-
76
-
77
-
78
-
79
-
80
-
81
-
82
-
83
-
84
-
85
-
86
-
87
-
88
-
89
-
90
-
91
-
92
-
93
-
94
-
95
-
96
 |
 |

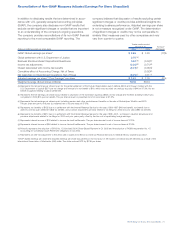
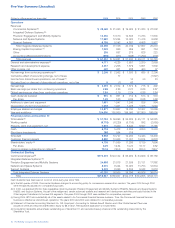
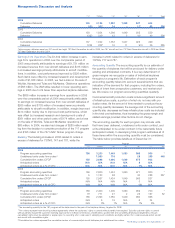
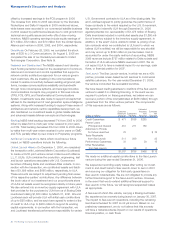
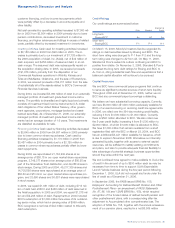
The most significant items included in Unallocated expense are
shown in the following table:
(Dollars in millions)
Year ended December 31, 2006 2005 2004
Pension and postretirement
expense $÷«(472)$÷«(851)$÷«(258)
Share-based plans expense (680)(999)(627)
Deferred compensation expense (211)(186)(54)
Other (370)(371)(372)
Unallocated expense $(1,733)$(2,407)$(1,311)
We recorded net periodic benefit cost related to pensions of
$1,050 million in 2006, $1,303 million in 2005, and $451 million
in 2004. Not all net periodic benefit cost is recognized in earn-
ings in the period incurred because it is allocated to production
as product costs and a portion remains in inventory at the end
of the reporting period. Accordingly, earnings from operations
included $746 million, $1,225 million and $335 million of pen-
sion expense in 2006, 2005, and 2004, respectively. A portion
of pension expense is recorded in the business segments and
the remainder is included in unallocated pension expense.
Unallocated pension and other postretirement expense repre-
sents the difference between costs recognized under GAAP in
the consolidated financial statements and federal cost account-
ing standards required to be utilized by our business segments
for U.S. Government contracting purposes. Net periodic benefit
cost related to pensions decreased in 2006 compared to 2005
mainly due to an absence of net settlement and curtailment
charges partially offset by an increase in the amount of actuarial
loss that was amortized. The increase in 2006 and 2005
deferred compensation plans expense is primarily due to the
increase in our stock price.
Higher pension and postretirement amounts in 2005 compared
to 2004 are primarily related to higher amortization of actuarial
losses and net settlement and curtailment charges due to 2005
divestitures. The increase in 2005 share-based plans expense is
primarily due to the increase in our stock price which resulted in
additional compensation expense due to an increase in the
number of performance shares meeting the price growth tar-
gets and being converted to common stock.
Other Earnings Items
(Dollars in millions)
Year ended December 31, 2006 2005 2004
Earnings from operations $3,014 $2,812 $2,007
Other income, net 420 301 288
Interest and debt expense (240)(294)(335)
Earnings before income taxes 3,194 2,819 1,960
Income tax expense (988)(257)(140)
Net earnings from
continuing operations $2,206 $2,562 $1,820
Other income primarily consists of interest income. Interest
income was higher in 2006 and 2005 as a result of higher
interest rates and higher cash and investment balances partially
offset by lower interest income related to federal income tax
settlements for prior years.
Interest and debt expense decreased in 2006 and 2005 due to
debt repayments.
The effective income tax rate of 30.9% for 2006 differed from
the 2005 effective income tax rate of 9.1% primarily due to the
favorable 2005 settlement with the Internal Revenue Service
and the non-deduction in 2006 of the global settlement with the
U.S. Department of Justice. The effective income tax rate of
9.1% for 2005 was comparable to the 2004 effective income
tax rate of 7.1%. Both 2005 and 2004 benefited from audit
settlements and export tax benefits. 2006 is the final year for
recognizing export tax benefits. For additional discussion
related to Income Taxes see Note 6.
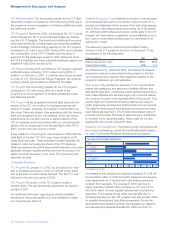
Backlog
Contractual backlog of unfilled orders excludes purchase options,
announced orders for which definitive contracts have not been
executed, and unobligated U.S. and non-U.S. Government
contract funding. Contractual backlog increased by $55,930 mil-
lion in 2006 compared to 2005 as a result of increases at
Commercial Airplanes of $50,144 million, which were primarily
due to new orders in excess of deliveries for the 737NG, 747
and 787 airplanes, and increases at IDS of $5,786 million which
were driven by funding received from new orders and existing
contracts for C-17, F/A-18, Integrated Logistics Chinook sup-
port, and Proprietary.
Unobligated backlog includes U.S. and non-U.S. Government
definitive contracts for which funding has not been authorized.
Funding that is subsequently received is moved to contractual
backlog. The decrease in IDS unobligated backlog of $10,584 mil-
lion during 2006 compared to 2005 is primarily due to funding
released from new orders and existing contracts on F/A-18,
Future Combat Systems (FCS), C-17, and Proprietary.
Segment Results of Operations and Financial Condition
Commercial Airplanes
Business Environment and Trends
Airline Industry Environment Air travel growth is driven by a
combination of economic growth and the increasing propensity
to travel due to increased trade, globalization and improved air-
line services driven by liberalization of air traffic rights between
countries. Air traffic growth continues to exceed its long-term
trend due to strong performance of these key drivers. Global
economic growth, the primary driver of air traffic growth,
remained above long-term trend for the third straight year in
2006. Evidence of increasing liberalization can be seen in the
declining restrictions on flights between countries, increasing
private ownership of airlines and reduced regulation of competi-
tion within markets.
Looking forward, our 20-year forecast is for a long-term aver-
age growth rate of 5% per year for passenger traffic, and 6%
per year for cargo traffic based on projected average annual
worldwide real economic growth rate of 3%. Based on long-
term global economic growth projections, and factoring in
increasing utilization of the worldwide airplane fleet and require-
ments to replace older airplanes, we project a $2.6 trillion
market for 27,200 new airplanes over the next 20 years.
The Boeing Company and Subsidiaries 25
Management’s Discussion and Analysis