Boeing 2006 Annual Report Download - page 45
Download and view the complete annual report
Please find page 45 of the 2006 Boeing annual report below. You can navigate through the pages in the report by either clicking on the pages listed below, or by using the keyword search tool below to find specific information within the annual report.-
 1
1 -
2
-
3
-
4
-
5
-
6
-
7
-
8
-
9
-
10
-
11
-
12
-
13
-
14
-
15
-
16
-
17
-
18
-
19
-
20
-
21
-
22
-
23
-
24
-
25
-
26
-
27
-
28
-
29
-
30
-
31
-
32
-
33
-
34
-
 35
35 -
 36
36 -
 37
37 -
 38
38 -
 39
39 -
 40
40 -
 41
41 -
 42
42 -
 43
43 -
 44
44 -
 45
45 -
 46
46 -
 47
47 -
 48
48 -
 49
49 -
 50
50 -
 51
51 -
 52
52 -
 53
53 -
 54
54 -
 55
55 -
56
-
57
-
58
-
59
-
60
-
61
-
62
-
63
-
64
-
65
-
66
-
67
-
68
-
69
-
70
-
71
-
72
-
73
-
74
-
75
-
76
-
77
-
78
-
79
-
80
-
81
-
82
-
83
-
84
-
85
-
86
-
87
-
88
-
89
-
90
-
91
-
92
-
93
-
94
-
95
-
96
 |
 |

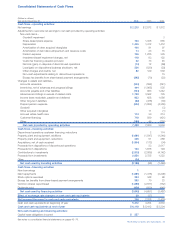
The Boeing Company and Subsidiaries 43
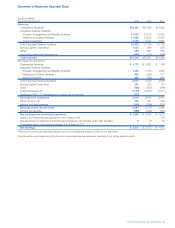
Consolidated Statements of Cash Flows
(Dollars in millions)
Year ended December 31 2006 2005 2004
Cash flows – operating activities:
Net earnings $«2,215 $«2,572 $«1,872
Adjustments to reconcile net earnings to net cash provided by operating activities:
Non-cash items –
Goodwill impairment 3
Share-based plans expense 743 1,036 655
Depreciation 1,445 1,412 1,412
Amortization of other acquired intangibles 100 91 97
Amortization of debt discount/premium and issuance costs 14 23 15
Pension expense 746 1,225 335
Investment/asset impairment charges, net 118 83 122
Customer financing valuation provision 32 73 45
Net loss (gain) on disposal of discontinued operations (14)12 (66)
Loss/(gain) on dispositions/business shutdown, net 226 (520)(23)
Other charges and credits, net 82 129 539
Non-cash adjustments relating to discontinued operations 15
Excess tax benefits from share-based payment arrangements (395)(70)(23)
Changes in assets and liabilities–
Accounts receivable (244)(592)(241)
Inventories, net of advances and progress billings 444 (1,965)535
Accounts payable and other liabilities (744)963 1,242
Advances and billings in excess of related costs 1,739 3,562 735
Income taxes receivable, payable and deferred 933 628 1,086
Other long-term liabilities (62)(476)(30)
Prepaid pension expense (522)(1,862)(4,355)
Goodwill (3)
Other acquired intangibles 11 (1)
Accrued retiree health care 114 30 214
Customer financing 718 589 (421)
Other (189)46 (255)
Net cash provided by operating activities 7,499 7,000 3,504
Cash flows – investing activities:
Discontinued operations customer financing, reductions 2 174
Property, plant and equipment, additions (1,681)(1,547)(1,246)
Property, plant and equipment, reductions 225 51 268
Acquisitions, net of cash acquired (1,854)(172)(34)
Proceeds from dispositions of discontinued operations 33 2,017
Proceeds from dispositions 123 1,676 194
Contributions to investments (2,815)(2,866)(4,142)
Proceeds from investments 2,850 2,725 1,323
Other (34)
Net cash used by investing activities (3,186)(98)(1,446)
Cash flows – financing activities:
New borrowings 1
Debt repayments (1,681)(1,378)(2,208)
Stock options exercised 294 348 98
Excess tax benefits from share-based payment arrangements 395 70 23
Common shares repurchased (1,698)(2,877)(752)
Dividends paid (956)(820)(648)
Net cash used by financing activities (3,645)(4,657)(3,487)
Effect of exchange rate changes on cash and cash equivalents 38 (37)
Net increase/(decrease) in cash and cash equivalents 706 2,208 (1,429)
Cash and cash equivalents at beginning of year 5,412 3,204 4,633
Cash and cash equivalents at end of year $«6,118 $«5,412 $«3,204
Non-cash investing and financing activities:
Capital lease obligations incurred $÷÷357
See notes to consolidated financial statements on pages 45 –79.