Volvo 1999 Annual Report Download - page 88
Download and view the complete annual report
Please find page 88 of the 1999 Volvo annual report below. You can navigate through the pages in the report by either clicking on the pages listed below, or by using the keyword search tool below to find specific information within the annual report.-
 1
1 -
2
-
3
-
4
-
5
-
6
-
7
-
8
-
9
-
10
-
11
-
12
-
13
-
14
-
15
-
16
-
17
-
18
-
19
-
20
-
21
-
22
-
23
-
24
-
25
-
26
-
27
-
28
-
29
-
30
-
31
-
32
-
33
-
34
-
35
-
36
-
37
-
38
-
39
-
40
-
41
-
42
-
43
-
44
-
45
-
46
-
47
-
48
-
49
-
50
-
51
-
52
-
53
-
54
-
55
-
56
-
57
-
58
-
59
-
60
-
61
-
62
-
63
-
64
-
65
-
66
-
67
-
68
-
69
-
70
-
71
-
72
-
73
-
74
-
75
-
76
-
77
-
 78
78 -
 79
79 -
 80
80 -
 81
81 -
 82
82 -
 83
83 -
 84
84 -
 85
85 -
 86
86 -
 87
87 -
 88
88 -
 89
89 -
 90
90 -
 91
91 -
 92
92 -
 93
93 -
 94
94 -
 95
95 -
 96
96 -
 97
97 -
 98
98 -
99
-
100
-
101
-
102
-
103
-
104
-
105
-
106
-
107
-
108
-
109
-
110
 |
 |

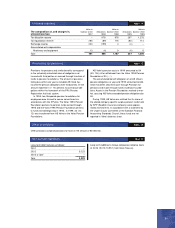
86
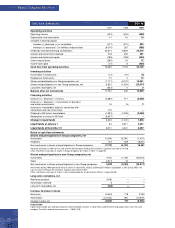
Parent Com pany AB Volvo
1997 1998 1999
Operating activities
Operating income (403) (494) (588)
Depreciation and amortization 11 19 19
Changes in working capital:
Increase (-)/ decrease (+) in receivables (477) (270) 893
Increase (+)/ decrease (-) in liabilities and provisions (9,079) 287 (888)
Dividends received and Group contributions 24,612 8,565 24,270
Interest and similar items received 218 339 491
Interest and similar items paid (788) (768) (684)
Other financial items (385) 23 72
Income taxes paid (10) 8 (460)
Cash flow from operating activities 13,699 7,709 23,125
Investing activities
Investments in fixed assets (14) (72) (2)
Disposals of fixed assets 70 4 12
Shares and participations in Group companies, net (1,177) (6,122) 15,441
Shares and participations in non-Group companies, net 5,822 (1,093) (25,517)
Long-term receivables, net (603) 0 0
Balance after net investments 17,797 426 13,059
Financing activities
Increase (+)/ decrease (-) in loans (4,680) 717 (8,566)
Increase (+)/ decrease (-) in provisions for pensions
and similar commitments 16 (5) 2
Increase in shareholders' equity in connection with
conversions and new share issue 116 – –
Dividend to AB Volvo's shareholders (1,993) (2,208) (2,649)
Redemption of shares in AB Volvo (5,807) – –
Change in liquid funds 5,449 (1,070) 1,846
Liquid funds at January 1 62 5,511 4,441
Liquid funds at December 31 5,511 4,441 6,287
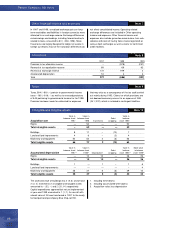
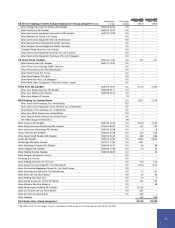
Notes to cash flow statements
Shares and participations in Group companies, net
Investments (1,334) (6,761) (1,431)
Disposals 157 639 16,872
Net investments in shares and participations in Group companies (1,177) (6,122) 15,441
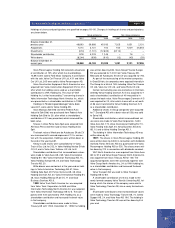
Proceeds received in 1999 from the sale of Volvo Personvagnar Holding AB resulted in a positive cash flow of 16,136.
Other investments and sales of shares in Group companies are shown in Note 11, page 89.
Shares and participations in non-Group companies, net
Investments (152) (1,125) (25,518)
Sales 5,974 32 1
Net investments in shares and participations in non-Group companies 5,822 (1,093) (25,517)
Investments during 1999 pertained mainly to shares in Scania AB, 23,023, and Mitsubishi Motors Corporation, 2,343. During 1997, the
sale of shares in Renault SA resulted in a positive cash flow of 5,934.
Other investments and sales of shares in non-Group companies are presented in Note 11, pages 89-90.
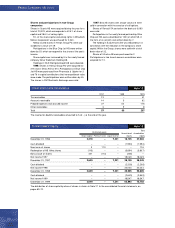
Long-term receivables, net
New loans granted (608) — —
Amortization received 5 — —
Long-term receivables, net (603) — —
Increase/ decrease in loans
New loans 16,363 778 2,363
Amortization (21,043) (61) (10,929)
Change in loans, net (4,680) 717 (8,566)
Liquid funds
Liquid funds include cash and bank balances and marketable securities in Volvo Treasury before offsetting against loans from the same
company. The offset amount was at year-end – (2,565; 328).
Cash flow statem ents SEK M