Volvo 1999 Annual Report Download - page 32
Download and view the complete annual report
Please find page 32 of the 1999 Volvo annual report below. You can navigate through the pages in the report by either clicking on the pages listed below, or by using the keyword search tool below to find specific information within the annual report.-
 1
1 -
2
-
3
-
4
-
5
-
6
-
7
-
8
-
9
-
10
-
11
-
12
-
13
-
14
-
15
-
16
-
17
-
18
-
19
-
20
-
21
-
 22
22 -
 23
23 -
 24
24 -
 25
25 -
 26
26 -
 27
27 -
 28
28 -
 29
29 -
 30
30 -
 31
31 -
 32
32 -
 33
33 -
 34
34 -
 35
35 -
 36
36 -
 37
37 -
 38
38 -
 39
39 -
 40
40 -
 41
41 -
 42
42 -
43
-
44
-
45
-
46
-
47
-
48
-
49
-
50
-
51
-
52
-
53
-
54
-
55
-
56
-
57
-
58
-
59
-
60
-
61
-
62
-
63
-
64
-
65
-
66
-
67
-
68
-
69
-
70
-
71
-
72
-
73
-
74
-
75
-
76
-
77
-
78
-
79
-
80
-
81
-
82
-
83
-
84
-
85
-
86
-
87
-
88
-
89
-
90
-
91
-
92
-
93
-
94
-
95
-
96
-
97
-
98
-
99
-
100
-
101
-
102
-
103
-
104
-
105
-
106
-
107
-
108
-
109
-
110
 |
 |

Fiscal year 1999
30
Trucks
Total m arket
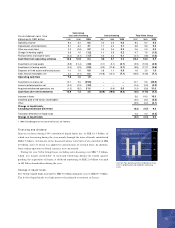
The world market for heavy trucks in 1999 amounted to approximately 750,000
(665,000) units. The market was characterized by strong demand and sharp competi-
tion. Markets in Western Europe and North America continued to increase from a high
level and the total number of trucks sold in both regions reached record levels,
237,000 (208,000) in Western Europe and 292,000 (236,000) in North America.
Demand in the South American markets continued to be weak during the year, while
activity in Southeast Asia increased slightly, from a low level.
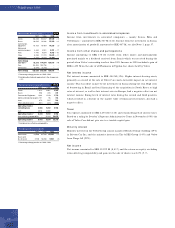
Sales and m arket shares
Volvo Trucks delivered 85,090 medium-heavy and heavy trucks in 1999, 2% more than
in the preceding year. Deliveries in Western Europe totalled 39,630 (37,810) trucks
and the company’s share of the market in the heavy-truck class was 15.0% (15.2).
Trucks delivered 34,300 (29,310) units in North America.The rate of production in the
United States was increased during the year to meet the very high demand, but the
increase could not fully match the upturn in the market and Volvo’s share of the market
for heavy (Class 8) trucks in the U.S. declined slightly, from 11.5% to 10.7%. Demand
in South America declined sharply. Trucks’ deliveries in Brazil decreased during the year
to 3,230 (4,090) units, and to 7,930 (12,070) units in the rest of South America and
other parts of the world.
Trucks’ net sales amounted to SEK 69,549 M (63,837).
Order bookings declined toward the end of the year; as a result, the backlog of
orders at December 31, 1999 was 21% lower than the very high level a year earlier.
The decline was attributable to a weakening market in North America toward the end
of the year. In Western Europe the order intake continued to be on a high level and the
order book in Europe was unchanged compared to December 31, 1998.
Operating incom e
Trucks’ operating income in 1999 rose to SEK 3,905 M (1998: 3,061, excluding items
affecting comparability). The increase was attributable to larger volumes of sales in
Western Europe and North America, to a favorable trend of prices in North America,
and to lower costs of materials as a result of rationalization measures and lower prices
for purchased materials. This could compensate for severe competition in Western
Europe, investments in marketing in China and India and larger investments in
product development. The operating margin rose to 5.6% (1998: 4.8%, excluding
items affecting comparability) and the return on operating capital exceeded 25%
(1998: >25%, excluding items affecting comparability).
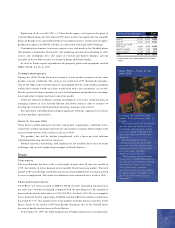
Production and capital expenditures
Volvo Trucks produced 84,660 (84,770) medium-heavy and heavy trucks in 1999.
Utilization of the industrial system continued to be high in both Europe and North
America. As a result of the record-high demand, Trucks’ production capacity in North
America was fully utilized during the year. An investment of slightly more than SEK
300 M was therefore made in the plant in New River Valley and the number of shifts
in the plant was increased in order to raise capacity. These measures will increase the
possible capacity by 8,000 vehicles, to 38,000 on an annual basis. However, as a conse-
quence of lower order booking at the end of 1999, the rate of production was reduced
and the plant’s capacity was not fully utilized the first part of 2000.
SEK M 1997 1998 1999
Net sales 50,840 63,837 69,549
Operating income11,812 3,061 3,905
Operating margin, %13.6 4.8 5.6
1 Excluding items affecting comparability during 1998.
Including items affecting comparability of SEK (46) M,
operating income amounted to SEK 3,015 M and
operating margin to SEK 4.7%.
1997 1998 1999
Western Europe 31,040 37,810 39,630
Eastern Europe 3,430 4,540 2,900
North America 20,900 29,310 34,300
South America 6,970 6,020 3,900
Asia 4,710 3,760 2,720
Other markets 1,930 1,840 1,640
Total 68,980 83,280 85,090
Volvo heavy Market share,
trucks registrations %
1998 1999 1998 1999
United States 24,060 28,180 11.5 10.7
Great Britain 5,600 6,090 18.3 19.3
France 5,590 5,850 14.5 13.5
Germany 3,880 4,290 7.7 7.3
Canada 3,440 4,090 12.8 13.3
Brazil 4,090 3,230 22.9 20.6
Key ratios Trucks
Num ber of vehicles invoiced Trucks
Largest m arkets Trucks
SEK M 1997 1998 1999
Western Europe 28,087 34,336 37,476
Eastern Europe 2,274 3,175 2,450
North America 12,610 18,714 23,515
South America 3,904 4,074 2,555
Asia 2,410 2,047 2,003
Other markets 1,555 1,491 1,550
Total 50,840 63,837 69,549
Net sales/ mark et
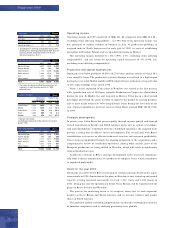
Total market developm ent Trucks
95
800
700
600
500
400
300
200
100
665 750
236 292
189 191
208
237
30
Tot al
Number of new trucks, registered, thousands >16 ton
96 97 98 99
Western
Europe
North
America
Japan
Other
32
Trucks