Volvo 1999 Annual Report Download - page 50
Download and view the complete annual report
Please find page 50 of the 1999 Volvo annual report below. You can navigate through the pages in the report by either clicking on the pages listed below, or by using the keyword search tool below to find specific information within the annual report.-
 1
1 -
2
-
3
-
4
-
5
-
6
-
7
-
8
-
9
-
10
-
11
-
12
-
13
-
14
-
15
-
16
-
17
-
18
-
19
-
20
-
21
-
22
-
23
-
24
-
25
-
26
-
27
-
28
-
29
-
30
-
31
-
32
-
33
-
34
-
35
-
36
-
37
-
38
-
39
-
 40
40 -
 41
41 -
 42
42 -
 43
43 -
 44
44 -
 45
45 -
 46
46 -
 47
47 -
 48
48 -
 49
49 -
 50
50 -
 51
51 -
 52
52 -
 53
53 -
 54
54 -
 55
55 -
 56
56 -
 57
57 -
 58
58 -
 59
59 -
 60
60 -
61
-
62
-
63
-
64
-
65
-
66
-
67
-
68
-
69
-
70
-
71
-
72
-
73
-
74
-
75
-
76
-
77
-
78
-
79
-
80
-
81
-
82
-
83
-
84
-
85
-
86
-
87
-
88
-
89
-
90
-
91
-
92
-
93
-
94
-
95
-
96
-
97
-
98
-
99
-
100
-
101
-
102
-
103
-
104
-
105
-
106
-
107
-
108
-
109
-
110
 |
 |

48
Number % of Share
of shares total votes capital, %
The funds of FöreningsSparbanken 32,528,586 10.1 7.4
The National Pension Insurance Fund,
Fourth Fund managing board 22,047,590 8.6 5.0
Svenska Handelsbanken
pensionsstiftelse (pension funds) 8,700,000 5.2 2.0
Skandia (insurance group) 12,475,701 4.8 2.8
Försäkringsbolaget SPP
(pension funds) 14,710,392 4.7 3.3
AMF Pensionsförsäkring AB
(labor market insurances) 12,100,000 4.4 2.7
Nordbankens aktiefonder
(saving funds) 8,159,639 3.5 1.8
SEB/ Trygg/ ABB aktiefonder
(saving funds) 6,806,970 2.9 1.5
AMF Försäkring (insurance group) 6,660,626 2.9 1.5
Parcitas Investment SA 4,975,000 2.9 1.1
Total 50.0 29.1
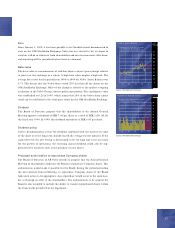
1989 1990 1991 1992 1993 1994 1995 1996 1997 1998 1999
Income, SEK 112.30 (2.60) 1.80 (8.60) (8.90) 31.80 20.20 26.90 23.20 19.10 73.00
Dividend, SEK 3.10 3.10 3.10 1.55 1.55 3.40 4.00 84.30 5.00 6.00 7.00 9
Share price at year-end, SEK (B share) 89 41 63 69 108 140 136 151 213 186 220
Direct return, % (B share) 23.5 7.6 4.9 2.3 1.4 2.4 2.9 2.9 2.3 3.2 3.2
Effective return, % (B share) 319 (50) 61 13 60 32 0 30 46 (10) 22
Price/ earnings ratio (B share) 47 neg 36 neg neg 4 7 6 9 9 3
EBIT multiple 58 45 neg neg 36 7 7 16 9 11 10
Payout ratio, % 625 neg 176 neg neg 11 20 16 22 31 10
Shareholders’ equity, SEK 797 91 87 77 70 98 110 125 140 157 221
Income as percentage of
average shareholders’ equity 13.3 neg 2.0 neg neg 36.5 19.3 23.7 17.2 13.0 34.9
1989 1990 1991 1992 1993 1994 1995 1996 1997 1998 1999
Number of shareholders at year-end 173,200 169,100 170,500 163,800 147,300 182,700 206,700 176,800 225,500 210,600 238,000
Number of Series A shares
at year-end, millions 25.3 25.3 25.3 25.3 25.3 142.2 142.2 142.2 138.6 138.6 138.6
Number of Series B shares
at year-end, millions 52.3 52.3 52.3 52.3 52.3 301.9 321.4 321.4 302.9 302.9 302.9
Number of Series A shares traded
in Stockholm during the year, millions 1.3 2.1 64.7 16.6 32.8 54.1 23.2 23.7 23.7 34.5 27.0
Number of Series B shares traded
in Stockholm during the year, millions 13.7 13.2 34.5 169.7 465.5 363.3 363.3 316.4 362.7 371.3 479.6
Number of A and B shares traded
in London during the year, millions 19.3 11.0 89.1 178.9 150.7 287.5 232.8 301.0 260.8 425.5 215.8
Number of shares traded in ADR,
NASDAQ during the year, millions 4.6 1.9 9.9 9.4 11.5 19.0 73.5 83.0 51.8 10 50.5 10 54.9 10
Number of % of Share of
Volvo shareholder owning shareholders total votes capital, %
1– 1,000 shares 220,580 6.7 9.1
1,001– 10,000 shares 16,357 6.3 9.4
10,001–100,000 shares 1,029 3.6 6.3
100,001– 259 83.4 75.2
Total 238,225 100 100
Data per share (adjusted for issues and splits) 1
Other share data
The largest shareholders in AB Volvo, Decem ber 31, 1999 Distribution of shares, Decem ber 31, 1999
1 Effective in 1997, adjustment was made to conform with the Swedish Financial
Accounting Standard Council's recommendation, RR9, Income Taxes. See Note 1 to
the consolidated financial statements. Income per share is calculated as net income
divided by average number of shares.
2 Dividend in SEK per share divided by share price at year-end.
3 Share price at year-end, including dividend paid during the year, divided by share price
at beginning of the year, including redemption 1997 and distribution of one share of
Swedish Match 1996.
4 Share price at year-end divided by income per share.
5 Market value at year-end plus net financial debt and minority interests (or minus finan-
cial net assets and minority share), divided by operating income, before items affecting
comparability.
6 Dividend divided by income per share.
7 Shareholders’ equity divided by number of shares outstanding at year-end.
8 Plus one share of Swedish Match per Volvo share, price of SEK 21.74 (weighted
average first ten trading days following listing).
9 Proposed by the Board of Directors.
10 Source NASDAQ - Amex Online.
The Volvo share