Volvo 1999 Annual Report Download - page 70
Download and view the complete annual report
Please find page 70 of the 1999 Volvo annual report below. You can navigate through the pages in the report by either clicking on the pages listed below, or by using the keyword search tool below to find specific information within the annual report.-
 1
1 -
2
-
3
-
4
-
5
-
6
-
7
-
8
-
9
-
10
-
11
-
12
-
13
-
14
-
15
-
16
-
17
-
18
-
19
-
20
-
21
-
22
-
23
-
24
-
25
-
26
-
27
-
28
-
29
-
30
-
31
-
32
-
33
-
34
-
35
-
36
-
37
-
38
-
39
-
40
-
41
-
42
-
43
-
44
-
45
-
46
-
47
-
48
-
49
-
50
-
51
-
52
-
53
-
54
-
55
-
56
-
57
-
58
-
59
-
 60
60 -
 61
61 -
 62
62 -
 63
63 -
 64
64 -
 65
65 -
 66
66 -
 67
67 -
 68
68 -
 69
69 -
 70
70 -
 71
71 -
 72
72 -
 73
73 -
 74
74 -
 75
75 -
 76
76 -
 77
77 -
 78
78 -
 79
79 -
 80
80 -
81
-
82
-
83
-
84
-
85
-
86
-
87
-
88
-
89
-
90
-
91
-
92
-
93
-
94
-
95
-
96
-
97
-
98
-
99
-
100
-
101
-
102
-
103
-
104
-
105
-
106
-
107
-
108
-
109
-
110
 |
 |

The Volvo Group
68
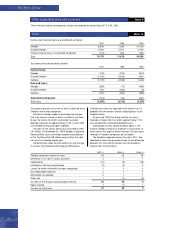
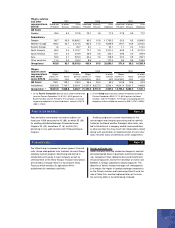
Increase (decrease) in obsolescence reserve 1997 1998 1999
Balance sheet, December 31, preceding year 1,184 1,310 1,738
Increase (decrease) in obsolescence reserve charged to income 89 232 233
Scrapping (48) (84) (247)
Acquired and divested operations 37 210 (376)
Translation differences 28 66 66
Other 20 4 (137)
Balance sheet, December 31 1,310 1,738 1,277
1997 1998 1999
Receivable from Ford Motor Company – – 12,125
Convertible debenture loan in Henlys – – 2,046
Other loans to external parties 2,269 3,313 3,434
Deferred tax assets 3,290 4,186 1,666
Other receivables 3,453 3,490 818
Total 9,012 10,989 20,089
As of 1999, deferred tax assets are reported as long-term receivables. Other receivables include interest-free
debenture loans to associated companies at a nominal value of – (2,700; 2,732).
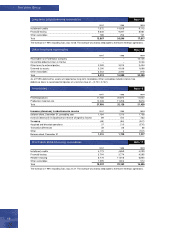
1997 1998 1999
Finished products 17,785 20,872 11,622
Production materials, etc. 10,208 11,256 9,816
Total 27,993 32,128 21,438
1997 1998 1999
Installment credits 4,173 4,859 4,099
Financial leasing 3,794 3,774 4,595
Retailer financing 8,775 11,815 6,890
Other receivables 1,595 1,804 912
Total 18,337 22,252 16,496
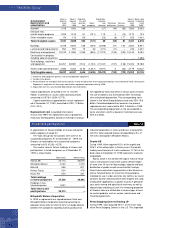
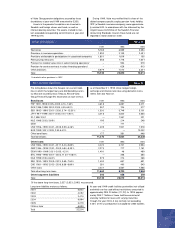
The increase in 1999, excluding Cars, was 3,137. The increase was mainly attributable to the North American operations.
Other long-term receivables Note 15
Inventories Note 16
Short-term sales-financing receivables Note 17
1997 1998 1999
Installment credits 7,572 14,956 9,115
Financial leasing 5,606 9,297 8,581
Other receivables 789 293 121
Total 13,967 24,546 17,817
The increase in 1999, excluding Cars, was 4,158. The increase was mainly attributable to the North American operations.
Long-term sales-financing receivables Note 14