Volvo 1999 Annual Report Download - page 78
Download and view the complete annual report
Please find page 78 of the 1999 Volvo annual report below. You can navigate through the pages in the report by either clicking on the pages listed below, or by using the keyword search tool below to find specific information within the annual report.-
 1
1 -
2
-
3
-
4
-
5
-
6
-
7
-
8
-
9
-
10
-
11
-
12
-
13
-
14
-
15
-
16
-
17
-
18
-
19
-
20
-
21
-
22
-
23
-
24
-
25
-
26
-
27
-
28
-
29
-
30
-
31
-
32
-
33
-
34
-
35
-
36
-
37
-
38
-
39
-
40
-
41
-
42
-
43
-
44
-
45
-
46
-
47
-
48
-
49
-
50
-
51
-
52
-
53
-
54
-
55
-
56
-
57
-
58
-
59
-
60
-
61
-
62
-
63
-
64
-
65
-
66
-
67
-
 68
68 -
 69
69 -
 70
70 -
 71
71 -
 72
72 -
 73
73 -
 74
74 -
 75
75 -
 76
76 -
 77
77 -
 78
78 -
 79
79 -
 80
80 -
 81
81 -
 82
82 -
 83
83 -
 84
84 -
 85
85 -
 86
86 -
 87
87 -
 88
88 -
89
-
90
-
91
-
92
-
93
-
94
-
95
-
96
-
97
-
98
-
99
-
100
-
101
-
102
-
103
-
104
-
105
-
106
-
107
-
108
-
109
-
110
 |
 |
The Volvo Group
76
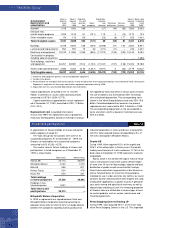
Commercial exposure
Volvo uses forward exchange contracts and currency
options to hedge the value of future payment flows.
Contracts related to hedging of anticipated sales and
purchases of foreign currency normally do not exceed
36 months. In accordance with the Group’s currency
policy, between 40% and 80% of the net flow in each
currency is hedged for the coming 12 months, 20% to
60% for months 13 through 24 and 0% to 40% for
months 25 through 36. The notional value of all forward
and options contracts as of December 31, 1999 was
SEK 25.0 billion (47.1;51.9).
Other
Inflow currencies currencies Total
SEK M USD GBP JPY EUR Net SEK
Due date 2000 amount 601 225 239 354 2.518
rate17.81 12.72 0.0674 8.93
Due date 2001 amount 461 139 180 225 961
rates17.85 12.86 0.0798 8.93
Due date 2002 amount 253 57 – 100 (193)
rate17.91 13.04 – 9.0335
Total 1,315 421 419 679 3,286
of which, options contracts 113 – – 16 –
Translated to actual value,
SEK210,301 5,388 28 5,816 3,220 24,998
Translated to SEK at
year-end exchange rates,
December 31, 1999 11,206 5,801 35 5,816 3,286 26,144
Difference between
actual value and
year-end exchange rates (905) (413) (7) 246 (66) (1,146)
Year-end exchange rates,
December 31, 1999 8.53 13.80 0.0835 8.56
1 Average contract rate.
2 Average forward contract rate and, for options, the most favorable of the year-end rate and contract rate.
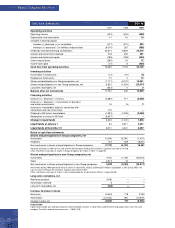
Volvo Group’s net flow per currency
Other
Inflow currencies currencies Total
SEK M USD GBP JPY EUR Net SEK
Net flow 1999 amount 794 313 762 901
rate38.2742 13.3834 0.0731 8.8245
Net flow SEK, 36,570 4,189 56 7,951 3,641 22,407
Hedged portion, % 476 72 31 39
3 Average exchange rate during the financial year.
4 Outstanding currency contracts, regarding commercial exposure due in 2000, percentage of net flow 1999.
Volvo Group’s outstanding currency contracts pertaining to commercial exposure, December 31, 1999
The table shows forward exchange contracts and options contracts to hedge future flows of commercial payments.
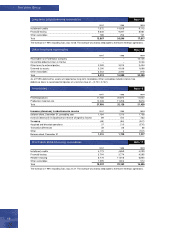
Financial exposure
Group companies operate in local currencies. Through
loans and investments being mainly in the local currency,
financial exposure is reduced. In companies which have
loans and investments in foreign currencies, hedging is
carried out in accordance with Volvo’s financial policy,
which means limited risk-taking.
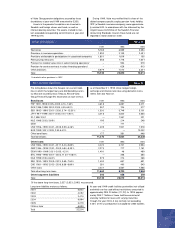
Equity exposure
In conjunction with translation of the Group’s assets and
liabilities in foreign subsidiaries to Swedish kronor, a risk
arises that the currency rate will have an effect on the
consolidated balance sheet. In accordance with the
Group’s currency policy, net investments (shareholders’
equity) in foreign subsidiaries and associated companies
are hedged up to 50%. Hedging is mainly done through
borrowing in the same currency as the net investments.
At year-end 1999, net assets in subsidiaries and associ-
ated companies outside Sweden amounted SEK 22 bil-
lion, of which 0% was hedged.