Volvo 1999 Annual Report Download - page 68
Download and view the complete annual report
Please find page 68 of the 1999 Volvo annual report below. You can navigate through the pages in the report by either clicking on the pages listed below, or by using the keyword search tool below to find specific information within the annual report.-
 1
1 -
2
-
3
-
4
-
5
-
6
-
7
-
8
-
9
-
10
-
11
-
12
-
13
-
14
-
15
-
16
-
17
-
18
-
19
-
20
-
21
-
22
-
23
-
24
-
25
-
26
-
27
-
28
-
29
-
30
-
31
-
32
-
33
-
34
-
35
-
36
-
37
-
38
-
39
-
40
-
41
-
42
-
43
-
44
-
45
-
46
-
47
-
48
-
49
-
50
-
51
-
52
-
53
-
54
-
55
-
56
-
57
-
 58
58 -
 59
59 -
 60
60 -
 61
61 -
 62
62 -
 63
63 -
 64
64 -
 65
65 -
 66
66 -
 67
67 -
 68
68 -
 69
69 -
 70
70 -
 71
71 -
 72
72 -
 73
73 -
 74
74 -
 75
75 -
 76
76 -
 77
77 -
 78
78 -
79
-
80
-
81
-
82
-
83
-
84
-
85
-
86
-
87
-
88
-
89
-
90
-
91
-
92
-
93
-
94
-
95
-
96
-
97
-
98
-
99
-
100
-
101
-
102
-
103
-
104
-
105
-
106
-
107
-
108
-
109
-
110
 |
 |

The Volvo Group
66
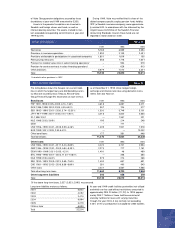
Value in Value in Deprecia- Subsidaries Value in Book value
Accumulated balance balance tion and acquired balance in balance
depreciation and sheet sheet amortiza- Sales/ and Translation Reclassi- sheet sheet
amortization 1997 1998 tion2scrapping divested differences fications 31999 1999 4
Goodwill 1,018 1,592 398 – (27) (44) (83) 1,836 5,093
Entrance fees,
aircraft engine programs 1,099 1,134 61 (131) 119 0 (13) 1,170 123
Other intangible assets 64 113 66 – (23) (8) 177 325 1,402
Total intangible assets 2,181 2,839 525 (131) 69 (52) 81 3,331 6,618
Buildings 6,478 6,840 236 (249) (3,298) (27) 152 3,654 6,921
Land and land improvements 554 597 19 (8) (371) (11) – 226 2,407
Machinery and equipment 129,019 31,550 2,259 (845) (17,372) (159) (290) 15,143 9,092
Construction in progress,
including advance payments – – – – – – – – 1,368
Total buildings, machinery
and equipment 36,051 38,987 2,514 (1,102) (21,041) (197) (138) 19,023 19,788
Assets under operating leases 2,986 5,354 2,132 (1,307) (1,971) 5 (34) 4,179 12,337
Total tangible assets 39,037 44,341 4,646 (2,409) (23,012) (192) (172) 23,202 32,125
1 Machinery and equipment pertains mainly to production equipment.
2 Includes write-downs.
3 Reclassification of intangible fixed assets pertains mainly to adjustment of the acquisition balance sheet related to Volvo Construction
Equipment’s acquisition of Samsung’s construction equipment operations during 1998.
4 Acquisition cost less accumulated depreciation and amortization.
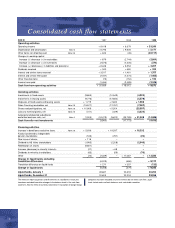
Capital expenditures amounted to 5,172 (10,549;
9,863). Investments in assets under operating leases
amounted to 5,578 (12,654; 9,773).
Capital expenditures approved but not yet implement-
ed at December 31, 1999, amounted to SEK 7.2 billion
(18.0; 20.0).
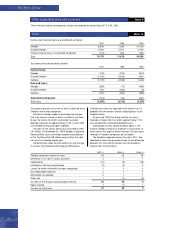
Replacement cost (unaudited information)
At year-end 1999, the replacement cost of properties,
machinery and equipment, based on methods of calcula-
tion applied by Volvo and which in certain cases involves
the use of indexes, was estimated at SEK 22.4 billion
after calculated depreciation. The corresponding value
shown in the Volvo Group balance sheet was SEK 19.8
billion. Calculated depreciation based on the present
replacement cost amounted to SEK 2.6 billion in 1999.
The corresponding depreciation in the consolidated in-
come statement, which is based on historical cost, was
SEK 2.5 billion.
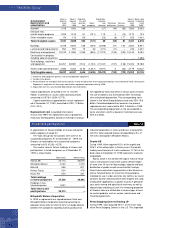
Shares and participations Note 13
Mitsubishi Motors Corporation
In 1999, an agreement was signed between Volvo and
Mitsubishi Motors Corporation covering ownership co-
operation and a letter of intent to form a strategic alliance
between the companies regarding market, product and
industrial cooperation in trucks and buses. In conjunction
with this, Volvo acquired shares corresponding to 5% of
the votes and capital in Mitsubishi Motors.
Scania AB
During 1999, Volvo acquired 43.5% of the capital and
28.6% of the voting rights in Scania, one of the world’s
leading manufacturers of trucks and buses. 17,740 of the
book value at December 31, 1999 represents unamortiz-
ed goodwill.
Scania, which is the world’s fifth largest make of heavy
trucks, manufactures trucks with a gross vehicle weight
of more than 16 tons for long haulage, regional and local
distribution of goods as well as construction haulage.
Scania’s bus and coach range consists of bus chassis as
well as fully built buses for more than 30 passengers,
intended for use in urban and inter-city traffic or as tourist
coaches. Scania’s industrial and marine engines are used,
among other applications, as power sources in generator
sets, earth-moving and agricultural machinery as well as
aboard ships and pleasure craft. An increasing proportion
of Scania’s sales are attributable to various types of servi-
ce market products, such as service, maintenance and
financing agreements.
Petro Stopping Centers Holding LP
During 1999, Volvo acquired 28.7% of the truck-stop
chain Petro Stopping Centers in the U.S. This expanded
A specification of Group holdings of shares and partici-
pations appears on page 92.
The Volvo Group has transactions with some of its
associated companies. As of December 31, 1999, the
Group’s net receivables from associated companies
amounted to 820 (6,260; 4,575).
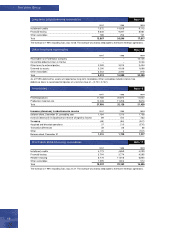
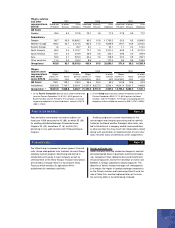
The market value of Volvo’s holdings of shares and
participations in listed companies as of December 31,
1999 is shown below.
Book value Market value
Scania AB 23,173 26,609
Mitsubishi Motors 2,343 1,413
Bilia AB 596 871
Henlys Group 524 478
Deutz AG 670 321
Total holdings
in listed companies 27,306 29,692
Holdings in non-
listed companies 1,907 –
Total shares and
participations 29,213 —