Volvo 1999 Annual Report Download - page 101
Download and view the complete annual report
Please find page 101 of the 1999 Volvo annual report below. You can navigate through the pages in the report by either clicking on the pages listed below, or by using the keyword search tool below to find specific information within the annual report.-
 1
1 -
2
-
3
-
4
-
5
-
6
-
7
-
8
-
9
-
10
-
11
-
12
-
13
-
14
-
15
-
16
-
17
-
18
-
19
-
20
-
21
-
22
-
23
-
24
-
25
-
26
-
27
-
28
-
29
-
30
-
31
-
32
-
33
-
34
-
35
-
36
-
37
-
38
-
39
-
40
-
41
-
42
-
43
-
44
-
45
-
46
-
47
-
48
-
49
-
50
-
51
-
52
-
53
-
54
-
55
-
56
-
57
-
58
-
59
-
60
-
61
-
62
-
63
-
64
-
65
-
66
-
67
-
68
-
69
-
70
-
71
-
72
-
73
-
74
-
75
-
76
-
77
-
78
-
79
-
80
-
81
-
82
-
83
-
84
-
85
-
86
-
87
-
88
-
89
-
90
-
 91
91 -
 92
92 -
 93
93 -
 94
94 -
 95
95 -
 96
96 -
 97
97 -
 98
98 -
 99
99 -
 100
100 -
 101
101 -
 102
102 -
 103
103 -
 104
104 -
 105
105 -
 106
106 -
 107
107 -
 108
108 -
 109
109 -
 110
110
 |
 |

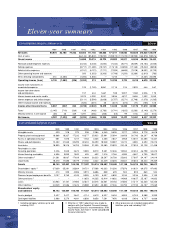
99
1989 1990 1991 1992 1993 1994 1995 1996 1997 1998 1999
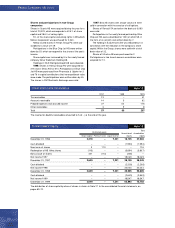
Intangible assets 4,544 5,623 2,258 3,262 5,678 6,469
Property, plant and equipment 25,950 25,071 26,431 30,677 36,045 19,686
Assets in operational leasing – – 49 1,366 1,817 1,542
Shares and participations 19,534 19,225 14,775 8,069 9,707 33,151
Inventories 23,047 23,813 23,042 27,756 31,876 21,041
Receivables in sales-financing operations – – – 227 252 9
Interest bearing receivables 1,516 2,720 4,060 4,664 4,715 18,617
Other receivables 28,958 26,616 24,838 26,346 31,865 22,099
Liquid funds 24,095 23,133 25,986 19,737 18,819 27,913
Assets 127,644 126,201 121,439 122,104 140,774 150,527
Shareholders’ equity 43,332 51,200 57,876 61,951 69,375 97,692
Minority interests 703 351 448 859 804 544
Provision for postemployment benefits 6,079 6,875 3,127 3,268 2,906 2,126
Other provisions 13,477 14,334 14,698 18,266 21,886 12,733
Loans 24,266 17,371 14,452 2,097 5,909 13,405
Other liabilities 39,787 36,070 30,838 35,663 39,894 24,027
Shareholders' equity and liabilities 127,644 126,201 121,439 122,104 140,774 150,527
Consolidated balance sheets excluding sales financing SEK M
1989 1990 1991 1992 1993 1994 1995 1996 1997 1998 1999
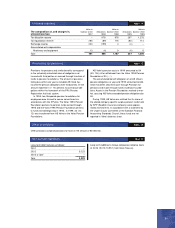
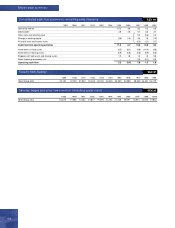
Operating income 15.1 (1.9) (0.8) (3.4) 0.3 9.4 10.2 3.7 8.4 6.7 6.6
Depreciation 2.7 3.0 3.1 3.1 3.8 5.1 5.6 5.4 6.8 9.6 5.2
Other items not affecting cash 20.6 0.0 0.5
Change in working capital 2(1.6) (0.1) (0.1) 5.1 2.4 (1.4) (4.2) (1.7) 4.7 1.5 (1.0)
Financial items and income tax 2(0.1) (1.8) (1.6)
Cash flow from
operating activities 6.2 1.0 2.2 4.8 6.5 13.1 11.6 7.4 20.4 16.0 9.7
Investments in fixed assets (6.5) (4.6) (2.9) (2.9) (3.5) (4.3) (6.5) (8.2) (9.9) (10.5) (4.9)
Investments in leasing assets (0.4) (1.2) (1.0) (1.3) (1.7) (2.5) (2.6) (3.9) (9.8) (12.7) (5.6)
Disposals of fixed assets and leasing assets 0.7 0.2 1.2 0.3 0.8 1.4 1.3 2.0 1.8 2.6 1.6
Sales-financing receivables, net (0.2) (0.3) (0.1) (3.7) 1.9 (1.5) (1.6) (4.8) (15.5) (12.8) (7.1)
Shares and participations, net (1.6) (5.4) (7.2) (0.2) 0.5 8.2 2.0 14.1 10.7 5.5 (25.9)
Loans to external parties, net 0.1 0.3 0.1 0.5 (0.2) (0.9) (0.9) (1.9) (0.4) (0.3) (3.2)
Acquired and divested subsidiaries
and other business units, net 0.0 (1.0) (0.2) 0.3 0.4 – (4.4) (0.9) (1.3) (5.6) 31.0
Cash flow after net investments (1.7) (11.0) (7.9) (2.2) 4.7 13.5 (1.1) 3.8 (4.0) (17.8) (4.4)
Increase (decrease) in loans 36.8 7.9 1.3 3.2 (5.9) (8.3) 1.5 6.8 5.6 19.5 16.3
Dividend to AB Volvo shareholders (1.1) (1.2) (1.2) (1.2) (0.6) (0.6) (1.5) (1.9) (2.0) (2.2) (2.6)
Other (1.7) 2.8 7.1 0.4 0.2 (1.3) 0.7 (5.0) (5.9) (0.2) (0.1)
Change in liquid funds,
excluding translation differences 2.3 (1.5) (0.7) 0.2 (1.6) 3.3 (0.4) 3.7 (6.3) (0.7) 9.2
Translation differences on liquid funds – – – 1.8 1.3 (0.3) (0.7) (0.3) 0.3 0.3 (0.2)
Change in long-term securities holdings 0.5 0.6 1.9 0.9 – – – – – – –
Change in liquid funds 2.8 (0.9) 1.2 2.9 (0.3) 3.0 (1.1) 3.4 (6.0) (0.4) 9.0
As from 1992 the effects of major acquisitions and divestments of subsidi-
aries as well as the distribution of the shares in Swedish Match 1996 have
been excluded from other changes in the balance sheet. Furthermore the
effects of changes in exchange rates at translation of foreign subsidiaries
have been excluded, since these effects do not effect cash flow.
1 1999, excluding gain on sale of Volvo Cars of SEK 26.7 billion.
2 Reported on a single line in 1989-1996.
3 Including pensions and similar commitments 1989-1991.
Consolidated cash flow statem ents SEK bn