Volvo 1999 Annual Report Download - page 28
Download and view the complete annual report
Please find page 28 of the 1999 Volvo annual report below. You can navigate through the pages in the report by either clicking on the pages listed below, or by using the keyword search tool below to find specific information within the annual report.-
 1
1 -
2
-
3
-
4
-
5
-
6
-
7
-
8
-
9
-
10
-
11
-
12
-
13
-
14
-
15
-
16
-
17
-
 18
18 -
 19
19 -
 20
20 -
 21
21 -
 22
22 -
 23
23 -
 24
24 -
 25
25 -
 26
26 -
 27
27 -
 28
28 -
 29
29 -
 30
30 -
 31
31 -
 32
32 -
 33
33 -
 34
34 -
 35
35 -
 36
36 -
 37
37 -
 38
38 -
39
-
40
-
41
-
42
-
43
-
44
-
45
-
46
-
47
-
48
-
49
-
50
-
51
-
52
-
53
-
54
-
55
-
56
-
57
-
58
-
59
-
60
-
61
-
62
-
63
-
64
-
65
-
66
-
67
-
68
-
69
-
70
-
71
-
72
-
73
-
74
-
75
-
76
-
77
-
78
-
79
-
80
-
81
-
82
-
83
-
84
-
85
-
86
-
87
-
88
-
89
-
90
-
91
-
92
-
93
-
94
-
95
-
96
-
97
-
98
-
99
-
100
-
101
-
102
-
103
-
104
-
105
-
106
-
107
-
108
-
109
-
110
 |
 |

26
Fiscal year 1999
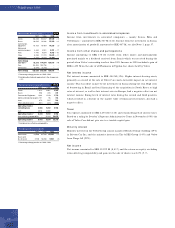
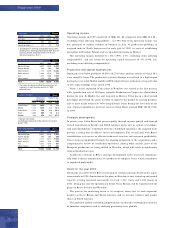
Income from investm ents in associated companies
Income from investments in associated companies – mainly Scania, Bilia and
Volvofinans – amounted to SEK 567 M (444). Income from the investment in Scania,
after amortization of goodwill, amounted to SEK 467 M, see also Note 1, page 57.
Income from other shares and participations
Income amounting to SEK 170 M (4,526) from other shares and participations
pertained mainly to a dividend received from Scania which was received during the
period when Volvo’s ownership was less than 20%. Income in 1998 included a gain of
SEK 4,452 M on the sale of all Pharmacia & Upjohn, Inc. shares held by Volvo.
Net interest incom e
Net interest income amounted to SEK 484 M (126). Higher interest-bearing assets,
primarily as a result of the sale of Volvo Cars, had a favorable impact on net interest
income. This was offset in part by the investment in Scania during the year. High costs
of borrowing in Brazil and local financing of the acquisition in South Korea at high
rates of interest, as well as low interest rates in Europe, had a negative effect on net
interest income. Rising levels of interest rates during the second and third quarters,
which resulted in a decline in the market value of financial investments, also had a
negative effect.
Tax es
Tax expense amounted to SEK 2,270 M (3,140) and consisted largely of current taxes.
Based on a ruling by Sweden’s Supreme Administrative Court in November 1999, the
sale of Volvo Cars did not give rise to a taxable capital gain.
Minority interest
Minority interests in the Volvo Group consist mainly of Henlys Group’s holding (49%)
in Prévost Car Inc. and the minority interests in The AGES Group (14%) and Volvo
Aero Norge AS (22%).
Net incom e
Net income amounted to SEK 32,222 M (8,437) and the return on equity, excluding
items affecting comparability and gains on the sale of shares, was 8.0% (9.7).
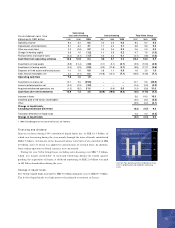
1997 1998 1999
Trucks 1, 812 3,061 3,905
Buses 550 385 241
Construction Equipment 1,444 1,549 1,736
Marine and industrial engines 181 95 314
Aero 472 527 584
Other and eliminations (551) (415) (226)
Operating income
excluding Cars 3,908 5,202 6,554
Cars 4,510 3,808 –
Operating income 18,418 9,010 6,554
Items affecting comparability – (2,331) 26,695
Operating income 8,418 6,679 33,249
1 Excluding items affecting comparability.
Operating income by business area
1997 1998 1999 %1
Volvo trucks 68,980 83,280 85,090 +2
Buses and
bus chassies 8,730 10,200 9,500 (7)
1 Percentage change pertains to 1999/ 1998.
Num ber of vehicles invoiced
1997 1998 1999 %1
Trucks 50,840 63,837 69,549 +9
Buses 10,582 14,286 15,160 +6
Construction
Equipment 16,758 19,469 19,295 (1)
Marine and
industrial engines 4,466 4,931 5,761 +17
Aero 7,476 8,584 9,953 +16
Other 9,292 11,772 13,070 +11
Eliminations (7,202) (8,025) (7,769) –
Volvo Group
excl Cars 292,212 114,854 125,019 +9
Cars 96,453 103,798 – –
Eliminations (5,040) (5,716) – –
Volvo Group 183,625 212,936 125,019 –
1 Percentage change pertains to 1999/ 1998.
2 Excluding divested and acquired units the change was
+8%.
Net sales by business area SEK M
SEK M