Volvo 1999 Annual Report Download - page 106
Download and view the complete annual report
Please find page 106 of the 1999 Volvo annual report below. You can navigate through the pages in the report by either clicking on the pages listed below, or by using the keyword search tool below to find specific information within the annual report.-
 1
1 -
2
-
3
-
4
-
5
-
6
-
7
-
8
-
9
-
10
-
11
-
12
-
13
-
14
-
15
-
16
-
17
-
18
-
19
-
20
-
21
-
22
-
23
-
24
-
25
-
26
-
27
-
28
-
29
-
30
-
31
-
32
-
33
-
34
-
35
-
36
-
37
-
38
-
39
-
40
-
41
-
42
-
43
-
44
-
45
-
46
-
47
-
48
-
49
-
50
-
51
-
52
-
53
-
54
-
55
-
56
-
57
-
58
-
59
-
60
-
61
-
62
-
63
-
64
-
65
-
66
-
67
-
68
-
69
-
70
-
71
-
72
-
73
-
74
-
75
-
76
-
77
-
78
-
79
-
80
-
81
-
82
-
83
-
84
-
85
-
86
-
87
-
88
-
89
-
90
-
91
-
92
-
93
-
94
-
95
-
 96
96 -
 97
97 -
 98
98 -
 99
99 -
 100
100 -
 101
101 -
 102
102 -
 103
103 -
 104
104 -
 105
105 -
 106
106 -
 107
107 -
 108
108 -
 109
109 -
 110
110
 |
 |
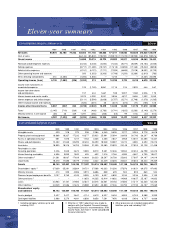
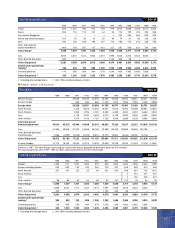
Eleven-year sum mary
104
1989 1990 1991 1992 1993 1994 1995 1996 1997 1998 1999
Trucks 1,245 1,525 1,870 2,258 1,365 1,399 1,760 2,078 2,051 2,301 2,524
Buses 181 213 256 251 240 265 306 343 434 617 576
Construction Equipment — —————221555627715786
Marine and industrial engines 127 178 180 166 154 148 177 183 213 270 287
Aero 151 150 163 194 196 160 150 155 205 248 216
Other 73 114 50 28 21 21 30 36 74 114 136
Volvo Group excluding
divested operations 1,777 2,180 2,519 2,897 1,976 1,993 2,644 3,350 3,604 4,265 4,525
Cars 4,329 4,851 3,895 3,346 2,462 2,502 4,561 4,901 5,055 5,839 —
Other divested operations 7030———15713820———
Volvo Group total 6,176 7,061 6,414 6,243 4,438 4,652 7,343 8,271 8,659 10,104 4,525
Figures for years 1992 through 1996 have been adjusted to conform with the new Annual Accounts Act.
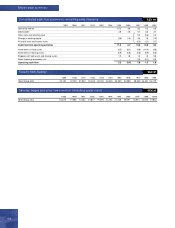
1989 1990 1991 1992 1993 1994 1995 1996 1997 1998 1999
Trucks 509 523 532 594 704 839 940 1,027 1,265 1,519 1,425
Buses 72 78 95 70 88 65 99 121 136 218 281
Construction Equipment – –––––143302394996 475
Marine and industrial engines 63 58 30 95 36 58 70 68 71 67 77
Aero 240 178 208 214 216 209 219 231 215 224 333
Other 226 245 320 136 160 155 165 213 346 423 448
Volvo Group excluding
divested operations 1,110 1,082 1,185 1,109 1,204 1,326 1,636 1,962 2,427 3,447 3,039
Cars 1,154 1,389 1,591 1,577 1,869 2,149 2,283 2,345 2,557 2,880 –
Other divested operations 271 150 13 0 152 1,025 953 206 – – –
2,535 2,621 2,789 2,686 3,225 4,500 4,872 4,513 4,984 6,327 3,039
Assets in operational leasing 1150 400 340 433 552 607 784 838 1,812 3,299 2,132
Depreciation, total 2,685 3,021 3,129 3,119 3 ,777 5,107 5,656 5,351 6,796 9,626 5,171
1 Company vehicles included to and including 1993.
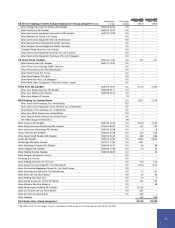
Depreciation and amortization SEK M
Research and developm ent expenses SEK M
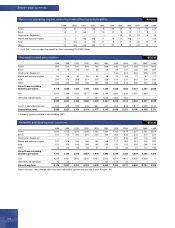
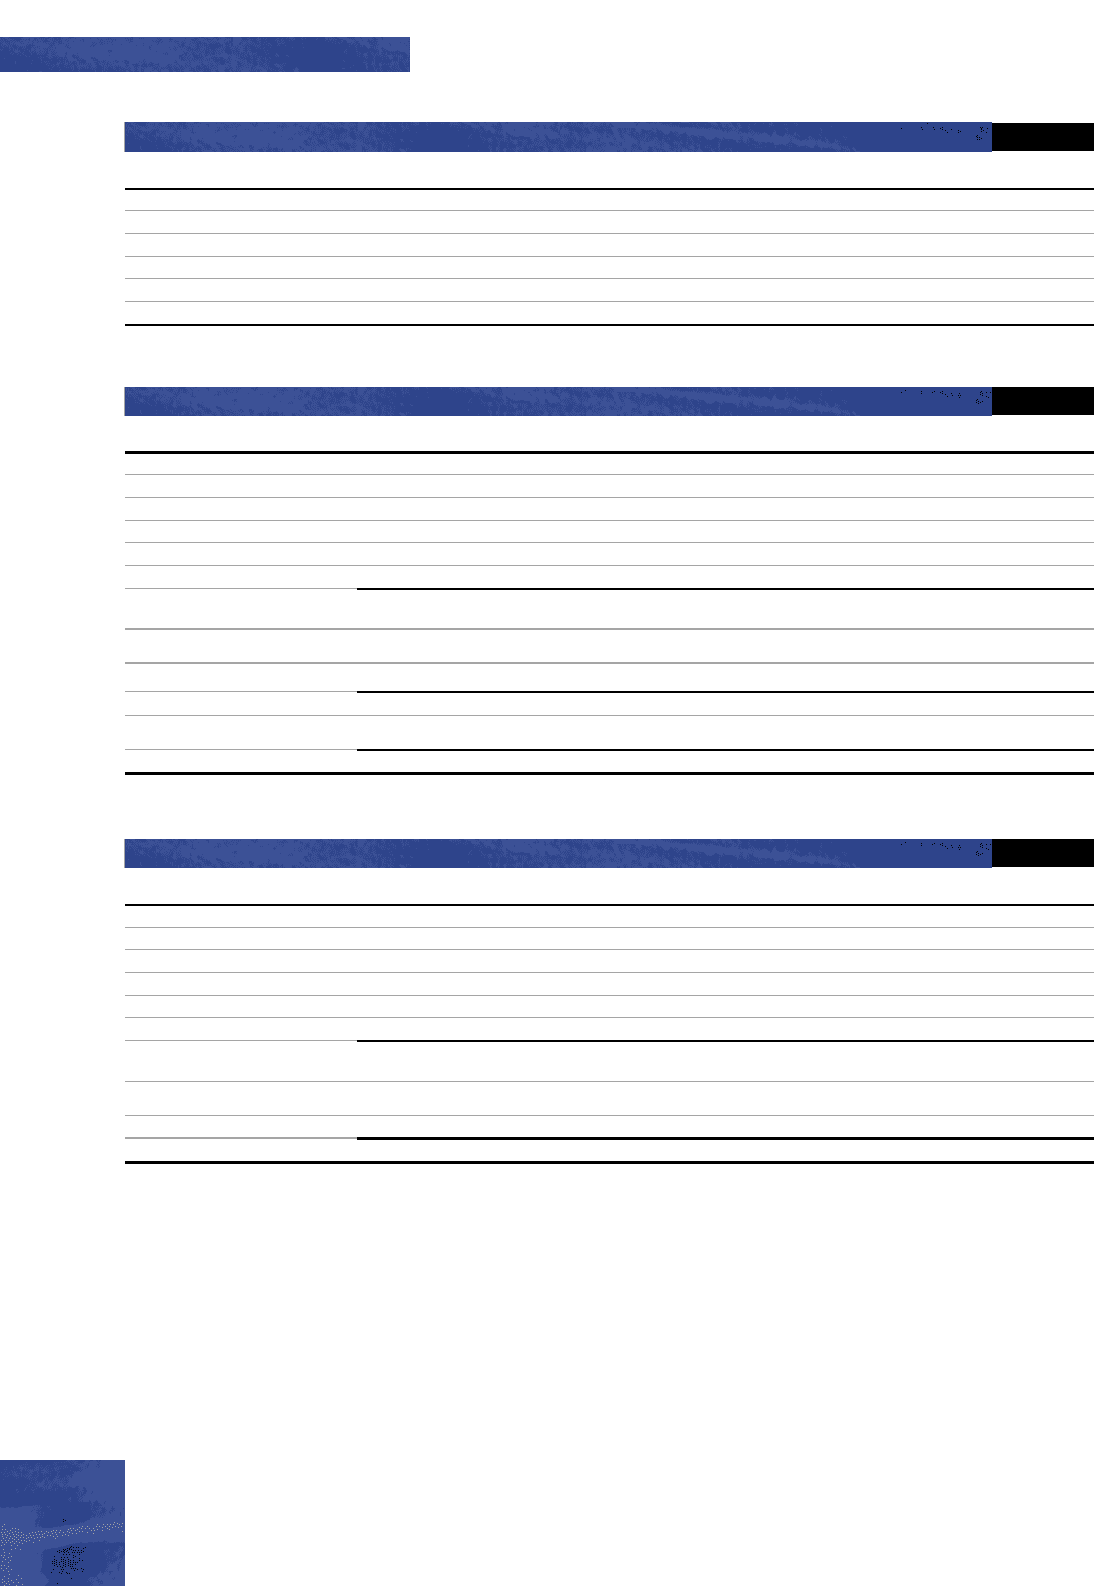
1989 1990 1991 1992 1993 1994 1995 1996 1997 1998 1999
Trucks >25 21 12 neg 8 >25 >25 10 18 >25 >25
Buses 18 4 neg 5 18 22 18 12 17 8 4
Construction Equipment — — — — — — >25 23 23 18 19
Marine and industrial engines 13 5 neg neg 11 19 17 neg 14 7 >25
Aero117 neg 12 22 11 5 13 19 >25 23 19
Cars 14 neg neg neg 4 21 8 12 >25 24 –
1 As of 1997, return on operating capital for Aero is excluding The AGES Group.
Return on operating capital, excluding item s affecting com parability Percent