Volvo 1999 Annual Report Download - page 29
Download and view the complete annual report
Please find page 29 of the 1999 Volvo annual report below. You can navigate through the pages in the report by either clicking on the pages listed below, or by using the keyword search tool below to find specific information within the annual report.-
 1
1 -
2
-
3
-
4
-
5
-
6
-
7
-
8
-
9
-
10
-
11
-
12
-
13
-
14
-
15
-
16
-
17
-
18
-
 19
19 -
 20
20 -
 21
21 -
 22
22 -
 23
23 -
 24
24 -
 25
25 -
 26
26 -
 27
27 -
 28
28 -
 29
29 -
 30
30 -
 31
31 -
 32
32 -
 33
33 -
 34
34 -
 35
35 -
 36
36 -
 37
37 -
 38
38 -
 39
39 -
40
-
41
-
42
-
43
-
44
-
45
-
46
-
47
-
48
-
49
-
50
-
51
-
52
-
53
-
54
-
55
-
56
-
57
-
58
-
59
-
60
-
61
-
62
-
63
-
64
-
65
-
66
-
67
-
68
-
69
-
70
-
71
-
72
-
73
-
74
-
75
-
76
-
77
-
78
-
79
-
80
-
81
-
82
-
83
-
84
-
85
-
86
-
87
-
88
-
89
-
90
-
91
-
92
-
93
-
94
-
95
-
96
-
97
-
98
-
99
-
100
-
101
-
102
-
103
-
104
-
105
-
106
-
107
-
108
-
109
-
110
 |
 |
27
Volvo Group
excl. sales financing 1Sales financing Total Volvo Group
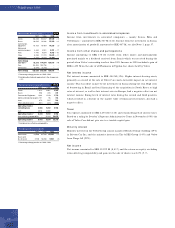
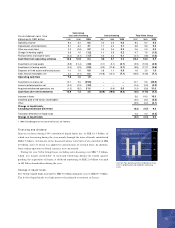
Volvo Group consolidated balance
sheets, Decem ber 31, SEK billion 1997 1998 1999 1997 1998 1999 1997 1998 1999
Assets
Intangible assets 3.3 5.7 6.5 0.0 0.1 0.1 3.3 5.8 6.6
Property, plant and equipment 30.7 36.0 19.7 0.1 0.2 0.1 30.8 36.2 19.8
Assets under operating leases 1.4 1.8 1.5 12.1 20.5 10.8 13.5 22.3 12.3
Shares and participations 8.1 9.7 33.2 0.7 0.7 0.7 4.6 3.4 29.2
Long-term sales finance receivables 0.2 0.1 0.0 13.8 24.4 17.8 14.0 24.5 17.8
Long-term interest-bearing receivables 2.2 3.3 17.6 0.0 0.0 0.0 2.2 3.3 17.6
Other long-term receivables 6.7 7.5 2.3 0.0 0.2 0.2 6.7 7.7 2.5
Inventories 27.8 31.9 21.0 0.2 0.2 0.4 28.0 32.1 21.4
Short-term sales finance receivables 0.0 0.1 0.0 18.3 22.2 16.5 18.3 22.3 16.5
Short-term interest bearing receivables 2.4 1.4 1.0 0.0 0.0 0.0 2.4 1.4 1.0
Other short-term receivables 19.5 24.4 19.8 0.9 2.1 1.8 20.4 26.5 21.6
Marketable securities 11.0 6.9 20.5 0.0 0.3 0.5 11.0 7.2 21.0
Cash and bank 8.8 11.9 7.4 0.8 1.1 0.9 9.6 13.0 8.3
Total assets 122.1 140.7 150.5 46.9 72.0 49.8 164.8 205.7 195.6
Shareholders’ equity and liabilities
Shareholders’ equity 61.9 69.4 97.7 4.2 7.0 4.7 61.9 69.4 97.7
Minority interests 0.9 0.8 0.5 0.0 0.1 0.0 0.9 0.9 0.5
Provision for post employment benefits 3.3 2.9 2.1 0.0 0.0 0.0 3.3 2.9 2.1
Other provisions 18.3 21.9 12.7 1.4 3.3 2.1 19.7 25.2 14.8
Loans 2.1 5.9 13.4 39.1 58.3 40.0 41.2 64.2 53.4
Other liabilities 35.6 39.8 24.1 2.2 3.3 3.0 37.8 43.1 27.1
Shareholders’ equity and liablities 122.1 140.7 150.5 46.9 72.0 49.8 164.8 205.7 195.6
Shareholders’ equity and minority
interests as percentage of total assets 51.4 49.9 65.3 9.1 9.8 9.4 38.1 34.1 50.2
1 Sales-financing operations are reported in accordance with the equity method. Internal receivables and liabilities related to the sales-financing operations are excluded.
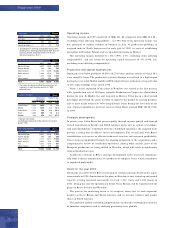
Financial position
The Group’s total assets at December 31, 1999 amounted to SEK 195.6 billion, a
reduction of SEK 10.1 billion compared with assets on the year-earlier date. The sale
of Volvo Cars, as well as other changes in the composition of the Group reduced total
assets by SEK 31.8 billion. Total assets were also reduced by SEK 0.3 billion as a result
of foreign exchange movements, while total assets were increased in the amount of
SEK 11.5 billion as a result of continuing expansion of the Group’s sales financing of
commercial products. The remaining increase, SEK 10.5 billion, was attributable
primarily to investments in fixed assets and shares and to subscription for a convertible
debenture loan issued by Henlys Group.
Shareholders’ equity increased by SEK 28.3 billion during the year and amounted
at year-end to SEK 97.7 billion. Net income provided SEK 32.2 billion, while the
dividend to AB Volvo’s shareholders and translation differences resulting from foreign
exchange movements reduced equity by SEK 2.6 billion and SEK 1.4 billion, respec-
tively.
The Volvo Group’s net financial assets at December 31, 1999 amounted to SEK
31.0 billion (14.8). The increase of SEK 16.2 billion during the year is shown in detail
in the following table.