Volvo 1999 Annual Report Download - page 103
Download and view the complete annual report
Please find page 103 of the 1999 Volvo annual report below. You can navigate through the pages in the report by either clicking on the pages listed below, or by using the keyword search tool below to find specific information within the annual report.-
 1
1 -
2
-
3
-
4
-
5
-
6
-
7
-
8
-
9
-
10
-
11
-
12
-
13
-
14
-
15
-
16
-
17
-
18
-
19
-
20
-
21
-
22
-
23
-
24
-
25
-
26
-
27
-
28
-
29
-
30
-
31
-
32
-
33
-
34
-
35
-
36
-
37
-
38
-
39
-
40
-
41
-
42
-
43
-
44
-
45
-
46
-
47
-
48
-
49
-
50
-
51
-
52
-
53
-
54
-
55
-
56
-
57
-
58
-
59
-
60
-
61
-
62
-
63
-
64
-
65
-
66
-
67
-
68
-
69
-
70
-
71
-
72
-
73
-
74
-
75
-
76
-
77
-
78
-
79
-
80
-
81
-
82
-
83
-
84
-
85
-
86
-
87
-
88
-
89
-
90
-
91
-
92
-
 93
93 -
 94
94 -
 95
95 -
 96
96 -
 97
97 -
 98
98 -
 99
99 -
 100
100 -
 101
101 -
 102
102 -
 103
103 -
 104
104 -
 105
105 -
 106
106 -
 107
107 -
 108
108 -
 109
109 -
 110
110
 |
 |

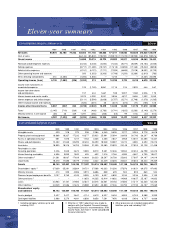
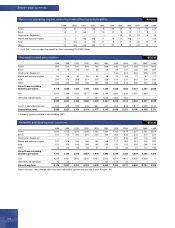
Key ratios 4
1989 1990 1991 1992 1993 1994 1995 1996 1997 1998 1999
Gross margin, % 120.3 22.8 26.2 25.1 22.3 24.3 23.0 21.2
Research and development expenses
as percentage of net sales 17.5 4.0 3.0 4.3 5.3 4.7 4.7 3.6
Selling expenses as percent of net sales 110.5 10.3 10.1 10.2 9.5 9.3 8.9 7.1
Administration expenses as
percentage of net sales 15.0 5.5 4.9 4.3 4.3 3.8 3.8 4.6
Operating margin, % 5.6 (2.3) (1.1) (4.0) 0.3 6.0 6.0 2.4 4.6 3.1 26.6
Return on shareholders' equity, % 13.3 neg 2.0 neg neg 36.5 19.3 23.7 17.2 13.0 34.9
Interest coverage, times 3.6 0.9 1.1 0.2 0.6 5.5 4.6 5.5 5.8 9.6 23.0
Self-financing ratio, % 2101 19 82 122 148 247 151 73 115 78 108
Self-financing ratio excl sales
finacing operations, % 2185 94 181 111 142
Financial net assets/ net debt, SEK M (3,011) (9,256) (11,357) (18,117) (20,592) (5,999) 1,245 12,007 19,108 14,815 31,000
Financial net assets/ net debt as
percentage of shareholders’
equity and minority interests (7.9) (26.0) (29.2) (53.9) (61.0) (13.6) 2.4 20.6 30.4 21.1 31.6
Shareholders’ equity and minority interests
as percentage of total assets 38.8 34.9 36.4 28.8 25.1 31.9 37.4 41.4 38.1 34.1 50.2
Shareholders’ equity and minority interests
as percentage of total assets, excluding
sales-financing operations 334.5 40.8 48.0 51.4 49.9 65.3
Shareholders' equity as
percentage of total assets 38.4 34.6 31.7 25.4 20.1 31.3 36.9 41.0 37.6 33.7 49.9
Excluding items affecting comparability and gain on sales of shares
Operating margin, % 5.3 0.7 (1.1) (2.3) 1.7 6.0 5.3 2.4 4.6 4.2 5.2
Return on shareholders' equity, % 13.3 3.6 neg neg 4.1 24.2 14.7 8.1 10.4 9.7 8.0
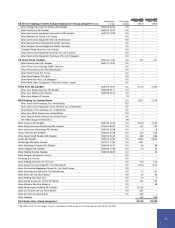
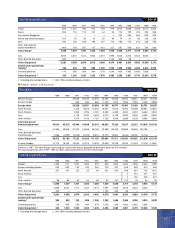
1989 1990 1991 1992 1993 1994 1995 1996 1997 1998 1999
Trucks 22,310 20,550 20,290 19,480 17,780 19,790 21,670 21,160 22,520 23,120 24,100
Buses 2,810 3,690 3,050 2,620 2,610 2,600 3,620 3,750 4,220 8,690 8,890
Construction Equipment — —————7,610 7,300 8,560 9,680 8,930
Marine and industrial engines 2,550 2,190 2,040 1,540 1,420 1,540 1,570 1,420 1,400 1,490 1,400
Aero 3,800 4,000 4,420 4,290 4,040 3,770 3,890 3,740 4,170 3,990 4,550
Other 4,310 4,740 4,210 3,740 3,350 2,350 2,600 3,350 4,110 5,490 5,600
Volvo Group, excluding
divested operations 35,780 35,170 34,010 31,670 29,200 30,050 40,960 40,720 44,980 52,460 53,470
Cars 34,610 33,630 29,570 28,450 26,800 29,080 31,050 29,600 27,920 27,360 —
Other divested operations 8,300 — — — 17,640 16,420 7,040 10 — — —
Volvo Group, total 78,690 68,800 63,580 60,120 73,640 75,550 79,050 70,330 72,900 79,820 53,470
1 Key ratios are stated in accordance with the new 1997 Annual Account
Act. Figures for the years 1992 through 1996 have been adjusted to
conform with the new principle.
2 As of 1999, Volvo's cash flow statement is presented in accordance
with the Swedish Financial Accounting Standards Council's recommen-
dation, Reporting of Cash Flow, RR7. Values in prior years are adjusted
in accordance with the new presentation form.
3 Sales-financing operations had a marginal effect on the percentage of
risk capital and minority capital prior to 1994.
4 Effective in 1997, adjustment was made to conform with the Swedish
Financial Accounting Standard Council’s recommendation, RR9, Income
Taxes. See Note 1, to the consolidated financial statements. Income per
share is calculated as net income divided by average number of shares.
BUSINESS AREA STATISTICS
Num ber of em ployees at year-end Number
101