Volvo 1999 Annual Report Download - page 31
Download and view the complete annual report
Please find page 31 of the 1999 Volvo annual report below. You can navigate through the pages in the report by either clicking on the pages listed below, or by using the keyword search tool below to find specific information within the annual report.-
 1
1 -
2
-
3
-
4
-
5
-
6
-
7
-
8
-
9
-
10
-
11
-
12
-
13
-
14
-
15
-
16
-
17
-
18
-
19
-
20
-
 21
21 -
 22
22 -
 23
23 -
 24
24 -
 25
25 -
 26
26 -
 27
27 -
 28
28 -
 29
29 -
 30
30 -
 31
31 -
 32
32 -
 33
33 -
 34
34 -
 35
35 -
 36
36 -
 37
37 -
 38
38 -
 39
39 -
 40
40 -
 41
41 -
42
-
43
-
44
-
45
-
46
-
47
-
48
-
49
-
50
-
51
-
52
-
53
-
54
-
55
-
56
-
57
-
58
-
59
-
60
-
61
-
62
-
63
-
64
-
65
-
66
-
67
-
68
-
69
-
70
-
71
-
72
-
73
-
74
-
75
-
76
-
77
-
78
-
79
-
80
-
81
-
82
-
83
-
84
-
85
-
86
-
87
-
88
-
89
-
90
-
91
-
92
-
93
-
94
-
95
-
96
-
97
-
98
-
99
-
100
-
101
-
102
-
103
-
104
-
105
-
106
-
107
-
108
-
109
-
110
 |
 |

29
Financing and dividend
Increases in loans during 1999 contributed liquid funds, net, of SEK 16.3 billion, of
which new borrowing during the year, mainly through the issue of bonds, contributed
SEK 19 billion. Settlement of the financial balance with Volvo Cars contributed SEK
20 billion, most of which was applied to amortization of external loans. In addition,
loans within operation in South America were amortized.
During the year, Volvo Group loans, excluding sales-financing, rose SEK 7.5 billion,
which was mainly attributable to increased borrowing during the fourth quarter
pending the acquisition of Scania. A dividend amounting to SEK 2.6 billion was paid
to AB Volvo shareholders during the year.
Change in liquid funds
The Group’s liquid funds increased by SEK 9.0 billion during the year, to SEK 29.3 billion.
The level of liquid funds was high prior to the planned investment in Scania.
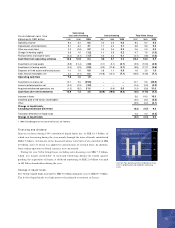
Volvo Group
excl. sales financing Sales financing Total Volvo Group
Consolidated cash flow
statem ents, SEK billion 1997 1998 1999 1997 1998 1999 1997 1998 1999
Operating income18.2 6.2 6.0 0.2 0.5 0.6 8.4 6.7 6.6
Depreciation and amortization 5.1 6.4 3.1 1.7 3.2 2.1 6.8 9.6 5.2
Other non-cash items 0.2 (0.6) 0.2 0.4 0.6 0.3 0.6 0.0 0.5
Change in working capital 3.6 1.0 (1.2) 1.1 0.5 0.2 4.7 1.5 (1.0)
Financial items and income taxes (0.3) (2.1) (1.7) 0.2 0.3 0.1 (0.1) (1.8) (1.6)
Cash flow from operating activities 16.8 10.9 6.4 3.6 5.1 3.3 20.4 16.0 9.7
Investments in fixed assets (9.8) (10.4) (4.8) (0.1) (0.1) (0.1) (9.9) (10.5) (4.9)
Investments in leasing assets (0.5) (0.9) (0.5) (9.3) (11.8) (5.1) (9.8) (12.7) (5.6)
Disposals of fixed assets and leasing assets 1.0 1.5 0.8 0.8 1.1 0.8 1.8 2.6 1.6
Sales finance receivables, net 0.3 (0.1) 0.0 (15.8) (12.7) (7.1) (15.5) (12.8) (7.1)
Operating cash flow 7.8 1.0 1.9
Investments in shares, net 10.7 5.5 (25.9) –––10.7 5.5 (25.9)
Loans to external parties, net (0.4) (0.3) (3.2) –––(0.4) (0.3) (3.2)
Acquired and divested operations, net (1.3) (5.0) 31.0 – (0.6) 0.0 (1.3) (5.6) 31.0
Cash flow after net investments 16.8 1.2 3.8 (20.8) (19.0) (8.2) (4.0) (17.8) (4.4)
Increase in loans 5.6 19.5 16.3
Dividends paid to AB Volvo’s shareholders (2.0) (2.2) (2.6)
Other (5.9) (0.2) (0.1)
Change in liquid funds,
excluding translation difference (6.3) (0.7) 9.2
Translation difference on liquid funds 0.3 0.3 (0.2)
Change in liquid funds (6.0) (0.4) 9.0
1 1999: Excluding gain on the sale of Volvo Cars, 26.7 billions.
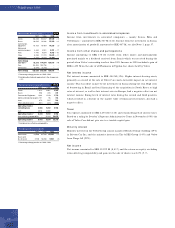
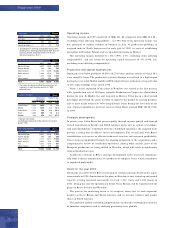
Cash flow from operating activities divided by net invest-
ments in property, plant and equipment and leasing
assets.
180
120
60
0
1997 1998 1999
Excluding sales-financing operations
%
Self-financing ratio