Volvo 1999 Annual Report Download - page 73
Download and view the complete annual report
Please find page 73 of the 1999 Volvo annual report below. You can navigate through the pages in the report by either clicking on the pages listed below, or by using the keyword search tool below to find specific information within the annual report.-
 1
1 -
2
-
3
-
4
-
5
-
6
-
7
-
8
-
9
-
10
-
11
-
12
-
13
-
14
-
15
-
16
-
17
-
18
-
19
-
20
-
21
-
22
-
23
-
24
-
25
-
26
-
27
-
28
-
29
-
30
-
31
-
32
-
33
-
34
-
35
-
36
-
37
-
38
-
39
-
40
-
41
-
42
-
43
-
44
-
45
-
46
-
47
-
48
-
49
-
50
-
51
-
52
-
53
-
54
-
55
-
56
-
57
-
58
-
59
-
60
-
61
-
62
-
 63
63 -
 64
64 -
 65
65 -
 66
66 -
 67
67 -
 68
68 -
 69
69 -
 70
70 -
 71
71 -
 72
72 -
 73
73 -
 74
74 -
 75
75 -
 76
76 -
 77
77 -
 78
78 -
 79
79 -
 80
80 -
 81
81 -
 82
82 -
 83
83 -
84
-
85
-
86
-
87
-
88
-
89
-
90
-
91
-
92
-
93
-
94
-
95
-
96
-
97
-
98
-
99
-
100
-
101
-
102
-
103
-
104
-
105
-
106
-
107
-
108
-
109
-
110
 |
 |

1997 1998 1999
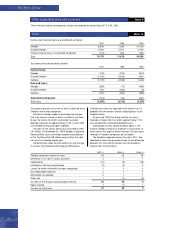
Warranties 5,769 6,599 3,594
Provisions in insurance operations 1,890 2,139 2,491
Provisions attributable to participations in associated companies 1,851 1,819 155
Restructuring measures 556 1,718 1,621
Provison for residual value risks in sales-financing operations 1– 954 519
Provision for service contracts in sales-financing operations1– 629 913
Other provisions 5,679 7,012 3,321
Total 15,745 20,870 12,614
1 Included in other provisions in 1997.
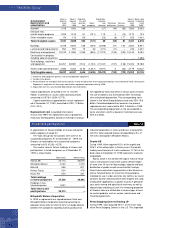
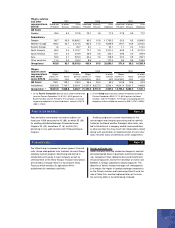
The listing below shows the Group’s non-current liabil-
ities in which the largest loans are distributed by curren-
cy. Most are issued by Volvo Treasury AB and Volvo
Group Finance Europe BV. Information on loan terms is
as of December 31, 1999. Volvo hedges foreign-
exchange and interest-rate risks using derivative instru-
ments. See also Note 32.
Bond loans 1997 1998 1999
FRF 1997-1998/ 2005–2009, 6.13–7.63% 4,618 3,887 3,271
DKK 1996-1998/ 2002-2005, 4.00-6.00% 357 704 377
SEK 1992–1999/ 2001–2008, 3.74–12.50% 1,300 3,749 3,101
JPY 1997–1999/ 2001–2005, 0.10–4.92% 3,216 2,640 4,654
ITL 1998/ 2001 — 1,357 221
NLG 1998/ 2003, 3.69% 195 214 248
DEM – 771 –
USD 1996–1999/ 2001–2008, 5.99–6.46% 1,409 1,921 1,918
EUR 1999/ 2001-2009, 2.50-5.40% — — 10,002
Other bond loans 177 381 446
Total bond loans 11,272 15,624 24,238
Other loans 1997 1998 1999
USD 1984–1999/ 2001–2017, 5.43–9.85% 3,222 3,721 2,954
GBP 1994–1999/ 2001–2009, 5.84–8.39% 2,273 777 1,151
DEM 1995–1999/ 2001–2005, 4.21% 1,491 46 489
BRL 1996–1998/ 2001–2003, 11.00–16.80% — 258 364
NLG 1998/ 2004, 6.60% 575 214 266
SEK 1992–1999/ 2003–2013, 3.63–7.50% 1,400 657 631
CAD 1981–1995/ 2002–2008, 8.66–8.89% 281 490 543
Other loans 2,421 3,567 1,586
Total other long-term loans 11,663 9,730 7,984
Other long-term liabilities 200 658 292
Total 23,135 26,012 32,514
Of the above long-term loans, 2,527 (2,823; 2,992) was secured.
Other provisions Note 23
Non-current liabilities Note 24
71
of Volvo Group pension obligations secured by these
foundations at year-end 1999 amounted to 3,355.
Assets in the pension foundations are invested in
Swedish and foreign shares and funds, as well as
interest-bearing securities. The assets, marked to mar-
ket, exceeded corresponding commitments at year-end
1999 by 575.
During 1999, Volvo was notified that its share of the
alloted company specific surplus pension funds held by
SPP (a Swedish insurance company) were approximate-
ly nominal 800. In accordance with the statement by the
Urgent Issues Committee of the Swedish Financial
Accounting Standards Council, these funds are not
reported in Volvo’s balance sheet.
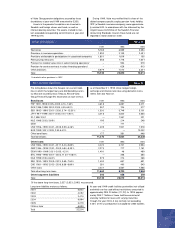
Long-term liabilities mature as follows:
2001 5,842
2002 4,092
2003 2,474
2004 9,994
2005 3,279
2006 or later 6,833
Total 32,514
At year-end 1999 credit facilities granted but not utilized
and which can be used without restrictions amounted to
approximately SEK 20 billion (22; 22). In 1999 approxi-
mately SEK 17 billion of these facilities consisted of
stand-by facilities for loans with varying maturities
through the year 2003. A fee normally not exceeding
0.25% of the unused portion is charged for credit facilities.