Volvo 1999 Annual Report Download - page 30
Download and view the complete annual report
Please find page 30 of the 1999 Volvo annual report below. You can navigate through the pages in the report by either clicking on the pages listed below, or by using the keyword search tool below to find specific information within the annual report.-
 1
1 -
2
-
3
-
4
-
5
-
6
-
7
-
8
-
9
-
10
-
11
-
12
-
13
-
14
-
15
-
16
-
17
-
18
-
19
-
 20
20 -
 21
21 -
 22
22 -
 23
23 -
 24
24 -
 25
25 -
 26
26 -
 27
27 -
 28
28 -
 29
29 -
 30
30 -
 31
31 -
 32
32 -
 33
33 -
 34
34 -
 35
35 -
 36
36 -
 37
37 -
 38
38 -
 39
39 -
 40
40 -
41
-
42
-
43
-
44
-
45
-
46
-
47
-
48
-
49
-
50
-
51
-
52
-
53
-
54
-
55
-
56
-
57
-
58
-
59
-
60
-
61
-
62
-
63
-
64
-
65
-
66
-
67
-
68
-
69
-
70
-
71
-
72
-
73
-
74
-
75
-
76
-
77
-
78
-
79
-
80
-
81
-
82
-
83
-
84
-
85
-
86
-
87
-
88
-
89
-
90
-
91
-
92
-
93
-
94
-
95
-
96
-
97
-
98
-
99
-
100
-
101
-
102
-
103
-
104
-
105
-
106
-
107
-
108
-
109
-
110
 |
 |
Fiscal year 1999
28
Cash flow statement
The Volvo Group’s operating cash flow in 1999, excluding sales-financing, amounted
to SEK 1.9 billion, which was SEK 0.3 billion lower than the pro forma operating cash
flow, excluding Volvo Cars (see table) in the preceding year. Operating cash flow was
charged with SEK 0.8 billion pertaining to the implementation of restructuring
measures that were approved, and for which provision was made, in 1998.
Net investments in fixed assets and leasing assets amounted to SEK 4.5 billion (5.1,
excluding Volvo Cars).
The Volvo Group’s total cash flow after net investments was negative in the amount
of SEK 4.4 billion (1998: negative, 17.8). The net of acquired and divested operations
provided SEK 31.0 billion. Acquisitions of shares reduced liquid funds by SEK 25.9
billion, and an increase in loans to external parties resulted in a negative cash flow of
SEK 3.2 billion, of which the payment for the convertible debenture loan issued by
Henlys was the largest single item. Continuing expansion within Volvo’s sales
financing of commercial products also resulted in a negative cash flow of SEK 8.2
billion. See pages 38–39 for more detailed description.
Capital expenditures
Capital expenditures for property, plant and equipment in 1999 amounted to SEK 5.2
billion (1998: 4.9, excluding Volvo Cars). Capital expenditures in Trucks, which
amounted to SEK 2.5 billion (2.6), included measures to increase possible production
capacity in the assembly plant in New River Valley in the United States, as well as in
the Swedish plants that manufacture components. In addition, investments in engine
production were made in Brazil, and marketing investments were made in Central and
Eastern Europe. Capital expenditures in Buses increased to SEK 0.6 billion (0.3), due
primarily to the ongoing restructuring of the European industrial operations that
involve concentration of production capacity in Wroclaw, Poland. Capital expendi-
tures in Construction Equipment amounted to SEK 0.6 billion (0.6), and included
completing the rebuilding of the plant in Asheville, North Carolina in the U.S. The
level of capital expenditures in Marine and Industrial Engines was unchanged, while
capital expenditures in Aero rose substantially, due primarily to the agreement
concluded with Boeing during the year.
Investments in leasing assets and sales-financing receivables (net) during 1999,
amounted to SEK 5.6 billion and SEK 7.1 billion, respectively. The investment
pertained mainly to the operations in North America and Western Europe.
Acquisitions and divestm ents
Acquisitions and divestments of subsidiaries and other business units in 1999 resulted
in a positive cash flow of SEK 31.0 billion. In connection with the sale of Volvo Cars
net liquid funds of SEK 31.8 billion was provided after deduction for the liquid funds
in the divested operations. The increased holding in The AGES Group and the acqui-
sition of 78% of Norsk Jetmotor reduced liquid funds by SEK 0.7 billion (see Note 2,
page 60 for more details). Investments in shares and participations in 1999 amounted
to SEK 25.9 billion, of which SEK 23.0 billion pertained to the acquisition of 43% of
the shares in Scania AB and SEK 2.3 billion was attributable to the acquisition of a 5%
stake in Mitsubishi Motors Corporation.
Approved but not yet implemented
at December 31, 1999
Trucks 5.3
Buses 0.5
Construction Equipment 0.5
Marine and industrial engines 0.0
Aero 0.8
Other companies and undistributed investments 0.1
Total 7.2
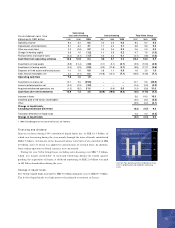
Operating cash flow,
excluding sales financing
Cash flow from operating activities with de-
ductions for net investments in fixed assets and
leasing assets.
Capital expenditures
Capital expenditures include investments in
buildings, machinery and equipment, as well as in
intangible assets. Investments pertaining to assets
under operating leases are not included.
Investments in fixed assets included in the
Group’s cash flow statement include only capital
expenditures that have reduced the Group’s liquid
funds during the year.
Definitions
Operating cash flow, excluding
sales-financing operations
1997 1998 1) 1999
Operating income 23.8 3.3 6.0
Depreciation 2.5 3.6 3.1
Other 3.6 0.4 (2.7)
Cash flow from
operating activities 9.9 7.3 6.4
Net investments in fixed
assets and leasing assets (3.9) (5.1) (4.5)
Operating cash flow,
Volvo Group, excluding
sales financing operations 6.0 2.2 1.9
1 Pro forma, excluding Cars. Volvo’s cash flow from
financial items in 1998 and 1997 has also been
adjusted to reflect the effects of the amount received
for Volvo Cars and the amounts paid for shares in
Scania in 1999.
2 1999: excluding gain on sale of Volvo Cars, SEK 26.7 bn.
SEK billion
December 31, 1998 14.8
Cash flow from operating activities 6.4
Net investments in fixed
assets and leasing assets (4.5)
Operating cash flow,
excluding
sales financing 1.9
Divestment of Volvo Cars 46.0
Acquisition of shares in Scania (23.0)
Acquistition of shares in Mitsubishi Motors (2.3)
Other acquired subsidiaries and shares 1(2.0)
Dividend to AB Volvo’s shareholders (2.6)
Other (1.8)
December 31, 1999 31.0
1 Including purchase amount and financial net debt in
acquired companies. See further Note 2, page 60.
Change in net financial assets SEK billion
Future capital expenditures SEK billion