Volvo 1999 Annual Report Download - page 102
Download and view the complete annual report
Please find page 102 of the 1999 Volvo annual report below. You can navigate through the pages in the report by either clicking on the pages listed below, or by using the keyword search tool below to find specific information within the annual report.-
 1
1 -
2
-
3
-
4
-
5
-
6
-
7
-
8
-
9
-
10
-
11
-
12
-
13
-
14
-
15
-
16
-
17
-
18
-
19
-
20
-
21
-
22
-
23
-
24
-
25
-
26
-
27
-
28
-
29
-
30
-
31
-
32
-
33
-
34
-
35
-
36
-
37
-
38
-
39
-
40
-
41
-
42
-
43
-
44
-
45
-
46
-
47
-
48
-
49
-
50
-
51
-
52
-
53
-
54
-
55
-
56
-
57
-
58
-
59
-
60
-
61
-
62
-
63
-
64
-
65
-
66
-
67
-
68
-
69
-
70
-
71
-
72
-
73
-
74
-
75
-
76
-
77
-
78
-
79
-
80
-
81
-
82
-
83
-
84
-
85
-
86
-
87
-
88
-
89
-
90
-
91
-
 92
92 -
 93
93 -
 94
94 -
 95
95 -
 96
96 -
 97
97 -
 98
98 -
 99
99 -
 100
100 -
 101
101 -
 102
102 -
 103
103 -
 104
104 -
 105
105 -
 106
106 -
 107
107 -
 108
108 -
 109
109 -
 110
110
 |
 |

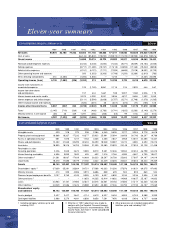
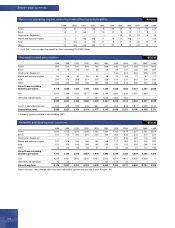
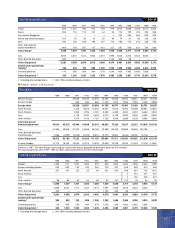
Eleven-year sum mary
100
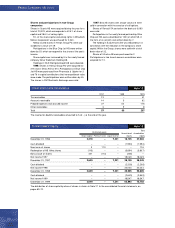
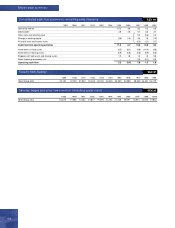
Consolidated cash flow statem ents excluding sales financing SEK bn
1989 1990 1991 1992 1993 1994 1995 1996 1997 1998 1999
Operating income 10.2 3.6 8.2 6.2 6.0
Depreciation 4.8 4.5 5.1 6.4 3.1
Other items not affecting cash 0.2 (0.6) 0.2
Change in working capital (3.5) (1.4) 3.6 1.0 (1.2)
Financial items and income taxes (0.3) (2.1) (1.7)
Cash flow from operating activities 11.5 6.7 16.8 10.9 6.4
Investments in fixed assets (6.5) (8.1) (9.8) (10.4) (4.8)
Investments in leasing assets (0.9) (0.8) (0.5) (0.9) (0.5)
Disposals of fixed assets and leasing assets 1.2 1.8 1.0 1.5 0.8
Sales-financing receivables, net – – 0.3 (0.1) 0.0
Operating cash flow 5.3 (0.4) 7.8 1.0 1.9
1989 1990 1991 1992 1993 1994 1995 1996 1997 1998 1999
Volvo Group, total 16,875 17,865 17,654 16,857 19,489 24,156 27,248 25,997 26,951 30,064 19,832
Salaries, wages and other remuneration (including social costs) SEK M
1989 1990 1991 1992 1993 1994 1995 1996 1997 1998 1999
Volvo Group, total 32,181 32,182 31,881 30,344 36,130 43,330 56,059 54,589 58,569 64,401 52,719
Exports from Sweden SEK M