Volvo 1999 Annual Report Download - page 34
Download and view the complete annual report
Please find page 34 of the 1999 Volvo annual report below. You can navigate through the pages in the report by either clicking on the pages listed below, or by using the keyword search tool below to find specific information within the annual report.-
 1
1 -
2
-
3
-
4
-
5
-
6
-
7
-
8
-
9
-
10
-
11
-
12
-
13
-
14
-
15
-
16
-
17
-
18
-
19
-
20
-
21
-
22
-
23
-
 24
24 -
 25
25 -
 26
26 -
 27
27 -
 28
28 -
 29
29 -
 30
30 -
 31
31 -
 32
32 -
 33
33 -
 34
34 -
 35
35 -
 36
36 -
 37
37 -
 38
38 -
 39
39 -
 40
40 -
 41
41 -
 42
42 -
 43
43 -
 44
44 -
45
-
46
-
47
-
48
-
49
-
50
-
51
-
52
-
53
-
54
-
55
-
56
-
57
-
58
-
59
-
60
-
61
-
62
-
63
-
64
-
65
-
66
-
67
-
68
-
69
-
70
-
71
-
72
-
73
-
74
-
75
-
76
-
77
-
78
-
79
-
80
-
81
-
82
-
83
-
84
-
85
-
86
-
87
-
88
-
89
-
90
-
91
-
92
-
93
-
94
-
95
-
96
-
97
-
98
-
99
-
100
-
101
-
102
-
103
-
104
-
105
-
106
-
107
-
108
-
109
-
110
 |
 |

Fiscal year 1999
32
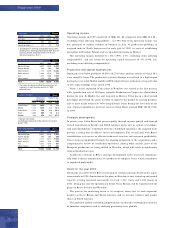
Operating incom e
Operating income in 1999 amounted to SEK 241 M, compared with SEK 385 M –
excluding items affecting comparability – in 1998. The lower operating income was
due primarily to smaller volumes of business in Asia, to production problems in
acquired units in North America in the early part of 1999, to costs of establishing
operations in Wroclaw, Poland, and to expanded operations in Mexico.
The operating margin declined to 1.6% (1998: 2.7%, excluding items affecting
comparability), and the return on operating capital decreased to 4% (1998: 8%,
excluding items affecting comparability).
Production and capital expenditures
During the year Volvo produced 10,050 (10,230) buses and bus chassis, of which 48%
were complete buses. The production system in Europe was utilized to a high degree
during the year, while MASA and Nova BUS reported lower utilization of capacity due
to low order bookings at the end of 1998.
Phase 1 in the expansion of the plant in Wroclaw, was started in the first quarter,
with a production rate of 300 buses annually. Production in Vienna was closed down
during the year. In MASA, the unit acquired in Mexico, Volvo has in a short period
developed and rebuilt the plant in order to improve the quality of existing products
and to meet major orders for Volvo long-distance buses during the later half of the
year. Capital expenditures for fixed assets in Volvo Buses reached SEK 586 M (320)
in 1999.
Strategic developm ent
In recent years, Volvo Buses has grown rapidly, through organic growth and through
several acquisitions in Europe and North America and is now in a phase of coordina-
tion and consolidation. Combined with the established operations, the acquired units
provide a strong base for Buses’ future development. The overall goal with Buses’
consolidation is to create an efficient industrial structure and sustained profitability.
This is being accomplished through the ongoing integration of the acquisitions and a
comprehensive review of established operations. Among other actions, parts of the
European production are being shifted to Wroclaw, which will result in significantly
reduced production costs.
Another key element in Buses’ strategic development is the successive transforma-
tion from a chassis manufacturer to a producer of complete buses, which contributes
to improved profitability.
Goals for the year 2000
During the year 2000 Volvo Buses is focusing on creating synergies based on the acqui-
sitions made in 1998. Production in the plant in Wroclaw, is now started up and annual
capacity is being increased successively to reach 1,100 buses and 1,400 chassis in
2001. During the year the operations in Irvine, Great Britain, will be transferred to the
plants in Borås, Sweden and Wroclaw.
The goal in the marketing sector is to recapture shares lost in such important
markets as Great Britain and South America, and to increase volumes and market
shares in North America.
The goals also include continuing improvements in efficiency through increased use
of common components and by reducing purchasing costs globally.
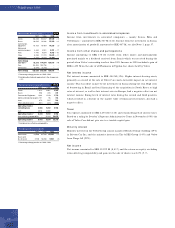
Volvo buses Market share,
registrations %
1998 1999 1998 1999
United States 1, 2 1,630 1,850 n.a n.a
Mexico 1,370 1,270 23.4 18.5
Great Britain 1,510 790 53.6 28.3
Brazil 11,090 460 9.0 6.4
Sweden 350 470 44.2 47.3
1 Delivery from factory.
2 Including the acquisition of Nova BUS as of second
quarter 1998.
Largest m arkets Buses
1997 1998 1999
Western Europe 4,030 3,580 3,430
Eastern Europe 160 280 200
North America11,110 2,730 3,640
South America 1,350 1,510 710
Asia 1,410 1,650 1,000
Other markets 670 450 520
Total 8,730 10,200 9,500
1 The impact on volume resulting from acquisitions of
companies in North America amounts to 1,000
delivered buses.
Num ber of vehicles invoiced Buses
SEK billion 1997 1998 1999
Western Europe 5,082 5,528 5,940
Eastern Europe 190 366 226
North America 2,314 5,574 7,022
South America 1,002 910 550
Asia 1,562 1,519 951
Other markets 432 389 471
Total 10,582 14,286 15,160
Net sales/ mark et
SEK M 1997 1998 1999
Net sales 10,582 14,286 15,160
Operating income 1550 385 241
Operating margin, % 15.2 2.7 1.6
1 Excluding items affecting comparability during 1998.
Including items affecting comparability of SEK (422) M
operating income amounted to SEK (37) M and
operating margin was (0.3)%.
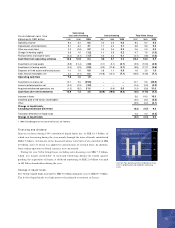
Key ratios Buses
Buses