Volvo 1999 Annual Report Download - page 26
Download and view the complete annual report
Please find page 26 of the 1999 Volvo annual report below. You can navigate through the pages in the report by either clicking on the pages listed below, or by using the keyword search tool below to find specific information within the annual report.-
 1
1 -
2
-
3
-
4
-
5
-
6
-
7
-
8
-
9
-
10
-
11
-
12
-
13
-
14
-
15
-
 16
16 -
 17
17 -
 18
18 -
 19
19 -
 20
20 -
 21
21 -
 22
22 -
 23
23 -
 24
24 -
 25
25 -
 26
26 -
 27
27 -
 28
28 -
 29
29 -
 30
30 -
 31
31 -
 32
32 -
 33
33 -
 34
34 -
 35
35 -
 36
36 -
37
-
38
-
39
-
40
-
41
-
42
-
43
-
44
-
45
-
46
-
47
-
48
-
49
-
50
-
51
-
52
-
53
-
54
-
55
-
56
-
57
-
58
-
59
-
60
-
61
-
62
-
63
-
64
-
65
-
66
-
67
-
68
-
69
-
70
-
71
-
72
-
73
-
74
-
75
-
76
-
77
-
78
-
79
-
80
-
81
-
82
-
83
-
84
-
85
-
86
-
87
-
88
-
89
-
90
-
91
-
92
-
93
-
94
-
95
-
96
-
97
-
98
-
99
-
100
-
101
-
102
-
103
-
104
-
105
-
106
-
107
-
108
-
109
-
110
 |
 |

%
Fiscal year 1999
24
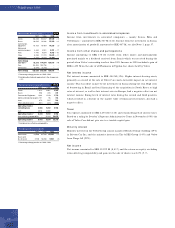
Net sales and income
Net sales
Net sales of the Volvo Group for 1999 amounted to SEK 125,019 M, compared with
SEK 114,854 M in the preceding year – excluding Volvo Cars – an increase of 9%. Net
sales were higher in Trucks, Buses, Marine and industrial engines, and Aero. Net sales
of Construction Equipment were virtually unchanged, while the business area’s
volumes of business and total market shares increased, compared with the preceding
year.
Adjusted for other companies divested and acquired, Volvo Group sales increased
8%.Trucks and Marine and industrial engines reported significant increases in sales, 9%
and 17%, respectively. Adjusted for acquired and divested companies, Construction
Equipment and Aero also reported a favorable trend of sales. Buses net sales were
unchanged, after adjustments for acquired companies.
The increase in sales continues to be attributable primarily to established markets.
Net sales in North America rose by 20%, and by 11% in Western Europe. These
markets combined account for 87% of the Group’s net sales. In Asia, demand for
Volvo’s products has gradually increased and sales have now recovered from the low
level of 1998. Construction Equipment’s acquisition in South Korea and larger
volumes delivered by both Marine and industrial engines and Aero contributed to the
increase. Demand in South America and Eastern Europe continued to weaken and
sales in these markets fell by 41% and 30%, respectively.
The number of Volvo trucks delivered in 1999 increased by 2%, to 85,090 (83,280)
and the number of buses and bus chassis delivered decreased by 7%, to 9,500 (10,200).
Construction Equipment sold more than 20,000 units for the first time.
Items affecting comparability
Items affecting comparability in 1999 included a gain of SEK 26,695 M on the sale of
Volvo Cars to Ford Motor Company. In 1998, provision amounting to SEK 2,331 M
was made for restructuring measures; of this amount, SEK 681 M pertained to Cars.
Operating incom e
Group operating income in 1999 amounted to SEK 33,249 M (6,679). Excluding
items affecting comparability, operating income amounted to SEK 6,554 M (1998:
5,202 excluding Cars), an increase of SEK 1,352 M.
The improvement in income is attributable primarily to larger volumes of sales for
the Group as a whole, to lower costs of materials and a favorable trend of prices for
Trucks in North America, to the positive effects of structural changes that were taken,
and to capital gains on the sale of companies in the Construction Equipment business
area. Income was also affected positively by a favorable foreign exchange situation as
well as by the decrease in reserves amounting to approximately SEK 240 M in Trucks’
sales-financing operations, that as a result of a favorable market trend are no longer
required. These factors compensated for the decline in volume of business in Buses
established operations and for higher product development costs for the Group as a
whole.
1999/ 1998 Consolidated as from Business area
Norsk Jetmotor AS March 1, 1999 Aero
MASA October 1, 1998 Buses
Volvo Construction Construction
Equipment Korea 2July 1, 1998 Equipment
Nova BUS April 1, 1998 Buses
BRS February 1, 1998 Trucks
Carrus Oy January 1, 1998 Buses
1 Ownership >50%
2 Previously Samsung Heavy Industries operations of
construction equipment.
For further information, see Note 2, page 60.
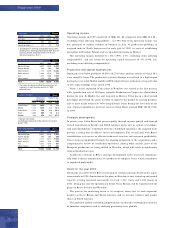
1997 1998 1999 %1
Western Europe 48,651 59,621 66,158 +11
Eastern Europe 2,769 4,160 2,899 (30)
North America 25,208 35,857 43,002 +20
South America 6,510 6,636 3,942 (41)
Asia 5,936 5,490 6,028 +10
Other markets 3,138 3,090 2,990 (3)
Volvo Group
excl Cars 92,212 114,854 125,019 +9
Cars 91,413 98,082 – –
Total 183,625 212,936 125,019 –
1 Percentage change pertains to 1999/ 1998.
Net sales per market area SEK M
Change of operating income SEK M
Operating income excluding
items affecting comparability 1998 9,010
Cars (3,808)
Increased volumes 1,120
Change in product and market mix, etc. (690)
Higher research and development expenses (260)
Decrease in provisions in
sales-financing operations 240
Capital gains on sale of companies
within Construction Equipment 210
Change in Group structure 60
Expenses incurred for a damage suit, 1998 120
Other 552
Operating income excluding
items affecting comparability 1999 6,554
Items affecting comparability 26,695
Operating income 1999 33,249
Com panies acquired 1
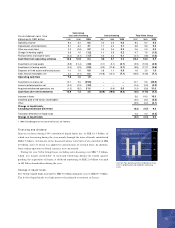
Excluding items
affecting comparability 1997 1998 1999
Trucks 3.6 4.8 5.6
Buses 5.2 2.7 1.6
Construction Equipment 8.6 8.0 9.0
Marine and industrial engines 4.1 1.9 5.5
Aero 6.3 6.1 5.9
Operating margin
excluding Cars 4.2 4.5 5.2
Cars 4.7 3.7 –
Total 4.6 4.2 5.2
Operating margin