Volvo 1999 Annual Report Download - page 48
Download and view the complete annual report
Please find page 48 of the 1999 Volvo annual report below. You can navigate through the pages in the report by either clicking on the pages listed below, or by using the keyword search tool below to find specific information within the annual report.-
 1
1 -
2
-
3
-
4
-
5
-
6
-
7
-
8
-
9
-
10
-
11
-
12
-
13
-
14
-
15
-
16
-
17
-
18
-
19
-
20
-
21
-
22
-
23
-
24
-
25
-
26
-
27
-
28
-
29
-
30
-
31
-
32
-
33
-
34
-
35
-
36
-
37
-
 38
38 -
 39
39 -
 40
40 -
 41
41 -
 42
42 -
 43
43 -
 44
44 -
 45
45 -
 46
46 -
 47
47 -
 48
48 -
 49
49 -
 50
50 -
 51
51 -
 52
52 -
 53
53 -
 54
54 -
 55
55 -
 56
56 -
 57
57 -
 58
58 -
59
-
60
-
61
-
62
-
63
-
64
-
65
-
66
-
67
-
68
-
69
-
70
-
71
-
72
-
73
-
74
-
75
-
76
-
77
-
78
-
79
-
80
-
81
-
82
-
83
-
84
-
85
-
86
-
87
-
88
-
89
-
90
-
91
-
92
-
93
-
94
-
95
-
96
-
97
-
98
-
99
-
100
-
101
-
102
-
103
-
104
-
105
-
106
-
107
-
108
-
109
-
110
 |
 |

46
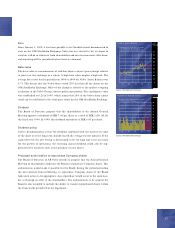
The stock market in 1999
Stocks showed strong price increases on both the Swedish and leading international
exchanges during 1999. The uncertainty at mid-year about inflation and interest rates
was replaced during the second half of the year by optimism regarding earnings
growth and subsequent share price increases. The OM Stockholm Exchange’s
General Index increased 66%.
The Volvo share in 1999
The Volvo share was listed on the Stockholm Stock Exchange in 1935. At that
time, share capital totaled SEK 13 M, and the number of shares was 260,000. At
year-end 1999, AB Volvo’s share capital amounted to SEK 2,649 M, represented
by 441,520,885 shares. These shares are distributed among approximately
238,000 shareholders, of whom 134,000 hold the shares in their own names, while
the shares of 104,000 shareholders are held in the names of trustees. The share
capital is divided into 138,604,945 Series A shares carrying one vote each and
302,915,940 Series B shares carrying one tenth of a vote each. The total number
of votes is 168,896,539. The par value of each share is SEK 6.
During 1999 the percentage of foreign shareholders declined from 33% of the
share capital (14% of the voting rights) to 28% (16%). Shares held by Swedish
owners were distributed among institutions, 56%, equities funds, 18%, and private
persons, 26%. O f Volvo’s 238,000 shareholders, the 50 largest accounted for more
than 82% of the voting rights and 74% of the share capital.
Volvo’s listings on foreign exchanges
The O M Stockholm Exchange accounts for the largest percentage of turnover,
with an average of 2.0 million Volvo shares traded each day. In 1999, Volvo was
the fourth most actively traded share in terms of volume on the “A” list, and the
seventh calculated in terms of market value, with a 2.6% share of the total capital-
ization. Apart from the OM Stockholm Exchange, most trading occurs in London
and on NASDAQ. Trading in Volvo shares in the U.S. is in the form of depositary
receipts (ADRs, American Depositary Receipts) representing an equal number of
Series B shares. The primary reason is to facilitate the clearing function, since this
can be handled entirely from the US. Turnover on NASDAQ increased by 9%
during the year, and the number of outstanding ADRs at December 31, 1999 de-
creased by 47% to 10.2 million.
The Volvo share
Stockholm 1935
London 1972
Frankfurt am Main,
Düsseldorf, Hamburg 1974
USA (NASDAQ) 1985
Brussels 1985
Tokyo 1986
Exchange listings of Volvo shares,
locations and year
The effective return on
Volvo shares – the divi-
dend plus the increase in
value of the shares –
amounted to 22% in
1999. Volvo’s market
value amounted to SEK
96 billion at year-end
1999.