Volvo 1999 Annual Report Download - page 104
Download and view the complete annual report
Please find page 104 of the 1999 Volvo annual report below. You can navigate through the pages in the report by either clicking on the pages listed below, or by using the keyword search tool below to find specific information within the annual report.-
 1
1 -
2
-
3
-
4
-
5
-
6
-
7
-
8
-
9
-
10
-
11
-
12
-
13
-
14
-
15
-
16
-
17
-
18
-
19
-
20
-
21
-
22
-
23
-
24
-
25
-
26
-
27
-
28
-
29
-
30
-
31
-
32
-
33
-
34
-
35
-
36
-
37
-
38
-
39
-
40
-
41
-
42
-
43
-
44
-
45
-
46
-
47
-
48
-
49
-
50
-
51
-
52
-
53
-
54
-
55
-
56
-
57
-
58
-
59
-
60
-
61
-
62
-
63
-
64
-
65
-
66
-
67
-
68
-
69
-
70
-
71
-
72
-
73
-
74
-
75
-
76
-
77
-
78
-
79
-
80
-
81
-
82
-
83
-
84
-
85
-
86
-
87
-
88
-
89
-
90
-
91
-
92
-
93
-
 94
94 -
 95
95 -
 96
96 -
 97
97 -
 98
98 -
 99
99 -
 100
100 -
 101
101 -
 102
102 -
 103
103 -
 104
104 -
 105
105 -
 106
106 -
 107
107 -
 108
108 -
 109
109 -
 110
110
 |
 |

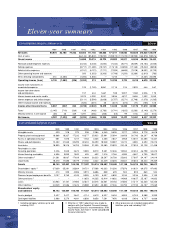
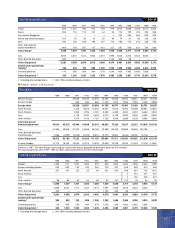
Eleven-year sum mary
102
1989 1990 1991 1992 1993 1994 1995 1996 1997 1998 1999
Trucks Western Europe 16,718 15,252 15,851 22.718 27.613 27.014 28.087 34.336 37.476
Eastern Europe 528 518 599 948 1.299 1.721 2.274 3.175 2.450
North America 5,714 6,933 11,817 13,951 13,075 8,564 12,610 18,714 23,515
South America 1,606 484 3,188 4,780 4,641 2,912 3,904 4,074 2,555
Asia 3,066 1,675 2,170 2,474 2,863 2,577 2,410 2,047 2,003
Other markets 435 1,130 330 1,379 1,536 1,487 1,555 1,491 1,550
Total 28,999 27,492 28,067 25,992 33,955 46,250 51,027 44,275 50,840 63,837 69,549
Buses Western Europe 2,600 2,581 3,380 3,838 4,709 4,660 5,082 5,528 5,940
Eastern Europe 12 3 62 102 34 80 190 366 226
North America 2 1 43 34 736 1,575 2,314 5,574 7,022
South America 522 728 897 1,005 1,087 853 1,002 910 550
Asia 514 572 986 868 844 1,112 1,562 1,519 951
Other markets 170 566 119 289 285 247 432 389 471
Total 3,682 3,927 3,820 4,451 5,487 6,136 7,695 8,527 10,582 14,286 15,160
Construction Western Europe 4,199 7,163 7,836 9,557 10,032
Equipment 1Eastern Europe 112 93 263 336 193
North America 1,403 3,385 5,785 6,645 5,982
South America 556 598 991 957 507
Asia 339 937 1,036 1,092 1,903
Other markets 307 628 847 882 678
Total 6,916 12,804 16,758 19,469 19,295
Marine and Western Europe 1,563 1,478 1,541 1,753 2,065 2,048 2,219 2,725 2,986
industrial Eastern Europe 0 0 0 0 1 2 34 23 26
engines North America 437 483 859 1,326 1,139 1,142 1,332 1,412 1,770
South America 159 92 74 92 99 109 136 153 134
Asia 406 407 434 464 458 486 643 476 692
Other markets 20 82 78 107 116 98 102 142 153
Total 2,735 2,927 2,585 2,542 2,986 3,742 3,878 3,885 4,466 4,931 5,761
Aero Western Europe 2,473 2,146 2,281 2,400 2,590 2,950 3,682 4,231 4,560
Eastern Europe 4 0 0 13 27 8 6 47 16
North America 1,208 1,244 1,326 1,104 1,100 1,071 3,066 3,502 4,557
South America 0 13 4 0 4 4 257 284 193
Asia 11 6 5 66 66 89 264 336 491
Other markets 4 9 11 5 3 21 201 184 136
Total 2,635 2,591 3,700 3,418 3,627 3,588 3,790 4,143 7,476 8,584 9,953
Other and eliminations 8,979 8,578 7,274 8,446 10,263 10,237 4,014 2,283 2,090 3,747 5,301
Volvo Group excluding
divested operations 47,030 45,515 45,446 44,849 56,318 69,953 77,320 75,917 92,212 114,854 125,019
Cars 41,356 39,569 37,022 44,598 58,158 73,598 83,340 83,589 96,453 103,798 –
Other divested operations
and eliminations 2,586 (1,899) (5,245) (6,445) (3,321) 12,315 10,851 (3,446) (5,040) (5,716) –
Volvo Group total 90,972 83,185 77,223 83,002 111,155 155,866 171,511 156,060 183,625 212,936 125,019
Effective in 1997, the Volvo Group's accounting per market area reflects
geographical definitions, based on an ISO-standard. The figures for
1991–1996 have been adjusted to conform the new principle.
1 Subsidiary in the Volvo Group as of July 1995. Net sales for the Con-
struction Equipment business area in the years 1991 through 1995, cal-
culated using the average exchange rate for the US dollar in each year,
amounted to SEK 8,273 M, SEK 7,890 M, SEK 9,665 M, SEK12,084 M
and SEK 13,684 M.
Net sales SEK M