Volvo 1999 Annual Report Download - page 65
Download and view the complete annual report
Please find page 65 of the 1999 Volvo annual report below. You can navigate through the pages in the report by either clicking on the pages listed below, or by using the keyword search tool below to find specific information within the annual report.-
 1
1 -
2
-
3
-
4
-
5
-
6
-
7
-
8
-
9
-
10
-
11
-
12
-
13
-
14
-
15
-
16
-
17
-
18
-
19
-
20
-
21
-
22
-
23
-
24
-
25
-
26
-
27
-
28
-
29
-
30
-
31
-
32
-
33
-
34
-
35
-
36
-
37
-
38
-
39
-
40
-
41
-
42
-
43
-
44
-
45
-
46
-
47
-
48
-
49
-
50
-
51
-
52
-
53
-
54
-
 55
55 -
 56
56 -
 57
57 -
 58
58 -
 59
59 -
 60
60 -
 61
61 -
 62
62 -
 63
63 -
 64
64 -
 65
65 -
 66
66 -
 67
67 -
 68
68 -
 69
69 -
 70
70 -
 71
71 -
 72
72 -
 73
73 -
 74
74 -
 75
75 -
76
-
77
-
78
-
79
-
80
-
81
-
82
-
83
-
84
-
85
-
86
-
87
-
88
-
89
-
90
-
91
-
92
-
93
-
94
-
95
-
96
-
97
-
98
-
99
-
100
-
101
-
102
-
103
-
104
-
105
-
106
-
107
-
108
-
109
-
110
 |
 |

63
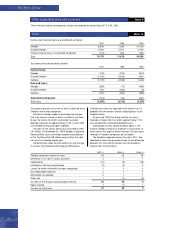
1 Divested in connection with the sale of Volvo Cars.
2 Consolidated in the Volvo Group since 1998.
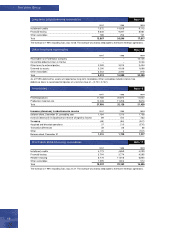
Volvo’s share of income in associated companies before taxes, is shown below:
Income (loss) Dividends received
1997 1998 1999 1997 1998 1999
Scania AB – – 467 – – –
Bilia AB 122 131 89 32 35 35
AB Volvofinans 82 87 89 6 7 8
Aviation Lease Finance – 3 7–––
Xian Silver Bus Corp 20 16 4 – – –
AVC Intressenter AB 23 6 1 – 506 81
Omninova Technology AB 0 0 (26) – – –
Turbec – (4) (22) – – –
Arrow Truck Sales – – (21) – – –
Petro Stopping Centers Holding LP – – (13) – – –
Other companies 16 (25) (10) 23 1 9
Holdings no longer reported as
equity method investments
Netherlands Car BV 1(128) 232 – – – –
AutoNova AB 1(45) 0 – – – –
VOCS Finance Ltd 147 16 – 84 85 –
ABB Olofström Automation AB 25 – – – – –
Banco Volvo Brasil SA 2(278) – – – – –
Other companies – (2) – – – –
Subtotal (116) 460 565 145 634 133
Gains (loss) on sale of shares
in associated companies
Pripps Ringnes AB 3,027 – –
Other companies 18 (16) 2
Subtotal 3,045 (16) 2
Total income from investments
in associated companies 2,929 444 567
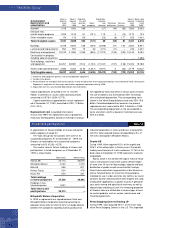
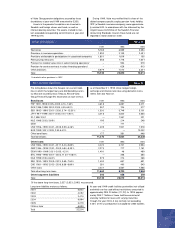
1997 1998 1999
Dividends received
Scania AB 2— — 180
Henlys Group Plc — — 13
Pharmacia & Upjohn, Inc. 165 43 —
SAS Sverige AB 10 — —
Other 20 3 8
Subtotal 195 46 201
Gain on sales of securities
Pharmacia & Upjohn, Inc. — 4,452 —
Stockholms Fondbörs AB — 33 —
Renault SA 783 — —
SAS Sverige AB 221 — —
Other (31) 1(5) 1(31)1
Subtotal 973 4,480 (31)
Total 1,168 4,526 170
1 Including write-down of shares.
2 Pertains to dividends received during the period when Volvo’s holding was less than 20%.
Income from investments in associated com panies Note 7
Income from other investments Note 8