Volvo 1999 Annual Report Download - page 27
Download and view the complete annual report
Please find page 27 of the 1999 Volvo annual report below. You can navigate through the pages in the report by either clicking on the pages listed below, or by using the keyword search tool below to find specific information within the annual report.-
 1
1 -
2
-
3
-
4
-
5
-
6
-
7
-
8
-
9
-
10
-
11
-
12
-
13
-
14
-
15
-
16
-
 17
17 -
 18
18 -
 19
19 -
 20
20 -
 21
21 -
 22
22 -
 23
23 -
 24
24 -
 25
25 -
 26
26 -
 27
27 -
 28
28 -
 29
29 -
 30
30 -
 31
31 -
 32
32 -
 33
33 -
 34
34 -
 35
35 -
 36
36 -
 37
37 -
38
-
39
-
40
-
41
-
42
-
43
-
44
-
45
-
46
-
47
-
48
-
49
-
50
-
51
-
52
-
53
-
54
-
55
-
56
-
57
-
58
-
59
-
60
-
61
-
62
-
63
-
64
-
65
-
66
-
67
-
68
-
69
-
70
-
71
-
72
-
73
-
74
-
75
-
76
-
77
-
78
-
79
-
80
-
81
-
82
-
83
-
84
-
85
-
86
-
87
-
88
-
89
-
90
-
91
-
92
-
93
-
94
-
95
-
96
-
97
-
98
-
99
-
100
-
101
-
102
-
103
-
104
-
105
-
106
-
107
-
108
-
109
-
110
 |
 |

25
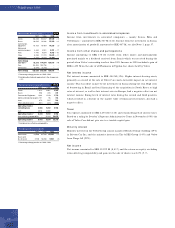
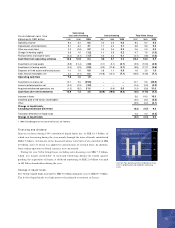
Excluding items affecting comparability, the operating margin was 5.2% (1998:
4.5%, excluding Volvo Cars). All business areas with the exception of Buses and Aero
reported operating margins that were higher than the previous year; and all business
areas except Buses are meeting Volvo’s objective, an operating margin in excess of 5%.
Impact of exchange rates on operating incom e
The effect of changes in currency exchange rates on operating income in 1999
compared with 1998, excluding Volvo Cars, was SEK 480 M.
During 1999, the Volvo Group has positive net flows in most currencies. The SEK
strengthened against the EUR, which resulted in a negative effect of about SEK 100 M.
This was offset by the SEK weakening against mainly the USD, CAD and GBP. The
total effect of changed spot-market rates was positive, approximately SEK 470 M.
Other effects of changed currency rates as well as forward hedging of payment
flows, translation of foreign subsidiaries and revaluation of balance sheet items only
had a marginal effect on the Group’s operating income.
Excluding Excluding
Cars Cars
Volvo Group consolidated
income statem ents, SEK M 1997 1997 1998 1998 1999
Net sales 183,625 92,212 212,936 114,854 125,019
Cost of sales (138,990) (71,153) (163,876) (89,305) (98,576)
Gross income 44,635 21,059 49,060 25,549 26,443
Research and development expenses (8,659) (3,604) (10,104) (4,265) (4,525)
Selling expenses (17,160) (7,691) (19,042) (8,929) (8,858)
Administrative expenses (7,018) (4,565) (8,091) (5,652) (5,723)
Other operating income and expenses (3,380) (1,291) (2,813) (1,501) (783)
Items affecting comparability 1— — (2,331) (1,650) 26,695
Operating income 8,418 3,908 6,679 3,552 33,249
Income from investments in associated companies 2,929 444 567
Income from other investments 1,168 4,526 170
Interest income and similar credits 3,486 1,502 2,049
Interest expenses and similar charges (2,748) (1,375) (1,565)
Other financial income and expenses (77) (157) 126
Income after financial items 13,176 11,619 34,596
Taxes (2,583) (3,140) (2,270)
Minority interests (112) (42) (104)
Net income 10,481 8,437 32,222
Income per share 23.20 19.10 73.00
1) Items affecting comparability in 1999 pertain to the sale of Volvo Cars and in 1998 to provisions for restructuring costs.
Compared to previous year
Net sales 1,080
Cost of sales (610)
Research and development expenses (110)
Selling and administrative expenses 0
Other operating income and expenses 120
Total effect of changes in exchange rates
on operating income excluding Cars 480
Group sales are reported at average spot prices and the
effects of currency hedges are reported among “Other
operating income and expenses”.
1997 1998 1999
USD 19,900 24,300 6,400
EUR (10,700) (18,000) 7,900
GBP 8,100 7,800 4,200
JPY 3,700 800 0
Other currencies 7,000 6,500 3,800
Total 28,000 21,400 22,300
Operating net flow per currency
1997 1998 1999
USD 6,000 6,400 6,400
EUR 7,200 6,900 7,900
GBP 2,300 2,700 4,200
JPY 0 (100) 0
Other currencies 2,900 2,200 3,800
Total 18,400 18,100 22,300
Operating net flow per currency,
excluding Cars
SEK M
SEK M
Im pact of exchange rates
on operating incom e SEK M