Volvo 1999 Annual Report Download - page 84
Download and view the complete annual report
Please find page 84 of the 1999 Volvo annual report below. You can navigate through the pages in the report by either clicking on the pages listed below, or by using the keyword search tool below to find specific information within the annual report.-
 1
1 -
2
-
3
-
4
-
5
-
6
-
7
-
8
-
9
-
10
-
11
-
12
-
13
-
14
-
15
-
16
-
17
-
18
-
19
-
20
-
21
-
22
-
23
-
24
-
25
-
26
-
27
-
28
-
29
-
30
-
31
-
32
-
33
-
34
-
35
-
36
-
37
-
38
-
39
-
40
-
41
-
42
-
43
-
44
-
45
-
46
-
47
-
48
-
49
-
50
-
51
-
52
-
53
-
54
-
55
-
56
-
57
-
58
-
59
-
60
-
61
-
62
-
63
-
64
-
65
-
66
-
67
-
68
-
69
-
70
-
71
-
72
-
73
-
 74
74 -
 75
75 -
 76
76 -
 77
77 -
 78
78 -
 79
79 -
 80
80 -
 81
81 -
 82
82 -
 83
83 -
 84
84 -
 85
85 -
 86
86 -
 87
87 -
 88
88 -
 89
89 -
 90
90 -
 91
91 -
 92
92 -
 93
93 -
 94
94 -
95
-
96
-
97
-
98
-
99
-
100
-
101
-
102
-
103
-
104
-
105
-
106
-
107
-
108
-
109
-
110
 |
 |

The Volvo Group
82
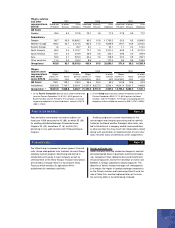
In calculating the provisions for pensions in accordance with U.S. GAAP, the following assumptions were applied:
Sweden United States
1997 1998 1999 1997 1998 1999
Discount rate, % 7.0 6.5 5.5 7.0 7.0 7.5
Payroll increase, % 4.0 3.5 3.0 4.0 4.5 7.0
Expected return on assets, % 9.0 7.0 7.0 9.0 9.0 6.5
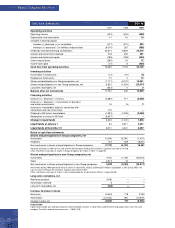
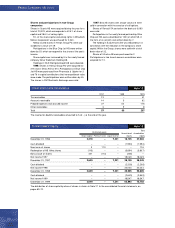
The table below shows the status in accordance with U.S. GAAP of defined benefit plans.
Sweden United States
Pension benefits Pension benefits Other benefits
Reconciliation of benefit obligation 1998 1999 1998 1999 1998 1999
Benefit obligation at beginning of year 4,268 5,557 1,985 2,380 1,154 1,238
Service cost 200 158 90 84 47 35
Interest cost 270 153 146 127 78 60
Plan amendments 0 (7) 140 134 0 (128)
Actuarial loss (gain) 1,028 (201) 138 (140) (35) (46)
Acquisitions/ divestments, net 0 (2,459) 0 (678) 0 (252)
Foreign exchange translation – – 49 118 29 43
Benefits paid (209) (96) (168) (109) (35) (44)
Benefit obligation at end of year 5,557 3,105 2,380 1,916 1,238 906
Sweden United States
Pension benefits Pension benefits Other benefits
Fair value of plan assets 11998 1999 1998 1999 1998 1999
Fair value of plan assets at beginning of year 4,859 5,519 1,951 2,200 – –
Lump sums not yet paid at beginning of year – – (3) 0 – –
Acquisitions/ divestments, net 0 (2,412) 0 (429) – –
Actual return on plan assets 348 645 272 199 – –
Employer contributions 312 (81) 77 49 – –
Foreign exchange translation – – 48 117 – –
Benefits paid 0 0 (145) (104) – –
Fair value of plan assets at end of year 5,519 3,671 2,200 2,032 – –
1 Assets in pension funds, estimated at fair value.
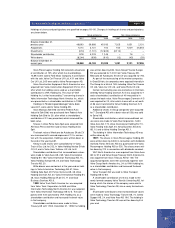
During 1999, Volvo was notified that its share of the
alloted company specific surplus pension funds held by
SPP (a Swedish insurance company) were approximate-
ly nominal 800. In accordance with the statement by the
Urgent Issues Committee of the Swedish Financial
Acoounting Standards Council, these funds are not
reported in Volvo’s balance sheet.
The projected benefit obligation, accumulated obliga-
tion and fair value of plan assets for the pension plans
with an accumulated benefit obligation in excess of plan
assets were 516, 499 and 374 at December 31, 1999
and 147, 171 and 48 at December 31, 1998.
Other post retirement benefit plans
In addition to its pension plans, the Company and certain
of its subsidiaries and associated companies sponsor
unfunded benefit plans, mainly in the U.S., to provide
health care and other benefits for retired employees who
meet minimum age and service requirements. The plans
are generally contributory, with retiree contributions being
adjusted periodically, and contain other cost-sharing
features such as deductibles and coinsurance. The esti-
mated cost for health-care benefits is recognized on an
accrual basis in accordance with the requirements of
SFAS 106, “Employers’ Accounting for Postretirement
Benefits Other than Pensions.”
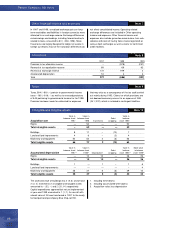
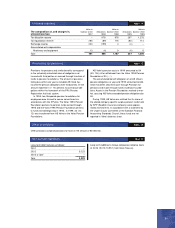
Sweden United States
Pension benefits Pension benefits Other benefits
Funded status 1998 1999 1998 1999 1998 1999
Funded status (37) 567 (180) 116 (1,238) (906)
Unrecognized actuarial loss (gain) 1,028 43 87 (110) (136) (159)
Unrecognized transition obligation (asset),
according to SFAS 87 (net) (141) (90) 0 1 276 56
Unrecognized prior service cost 608 0 177 126 0 0
Adjustment to minimum liability 0 (78) (3) 0 0 0
Net amount recognized 1,458 442 81 133 (1,098) (1,009)