Sears 2007 Annual Report Download - page 88
Download and view the complete annual report
Please find page 88 of the 2007 Sears annual report below. You can navigate through the pages in the report by either clicking on the pages listed below, or by using the keyword search tool below to find specific information within the annual report.-
 1
1 -
2
-
3
-
4
-
5
-
6
-
7
-
8
-
9
-
10
-
11
-
12
-
13
-
14
-
15
-
16
-
17
-
18
-
19
-
20
-
21
-
22
-
23
-
24
-
25
-
26
-
27
-
28
-
29
-
30
-
31
-
32
-
33
-
34
-
35
-
36
-
37
-
38
-
39
-
40
-
41
-
42
-
43
-
44
-
45
-
46
-
47
-
48
-
49
-
50
-
51
-
52
-
53
-
54
-
55
-
56
-
57
-
58
-
59
-
60
-
61
-
62
-
63
-
64
-
65
-
66
-
67
-
68
-
69
-
70
-
71
-
72
-
73
-
74
-
75
-
76
-
77
-
 78
78 -
 79
79 -
 80
80 -
 81
81 -
 82
82 -
 83
83 -
 84
84 -
 85
85 -
 86
86 -
 87
87 -
 88
88 -
 89
89 -
 90
90 -
 91
91 -
 92
92 -
 93
93 -
 94
94 -
 95
95 -
 96
96 -
 97
97 -
 98
98 -
99
-
100
-
101
-
102
-
103
-
104
-
105
-
106
-
107
-
108
-
109
-
110
 |
 |

SEARS HOLDINGS CORPORATION
Notes to Consolidated Financial Statements—(Continued)
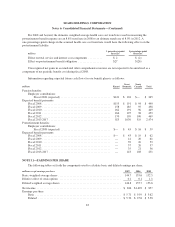
2007 2006 2005
Effective tax rate reconciliation
Federal income tax rate ............................................ 35.0% 35.0% 35.0%
State and local taxes net of federal tax benefit ........................... 2.0 3.1 3.3
Tax credits ...................................................... (0.4) (0.3) (0.3)
Equity in net income of affiliated companies ........................... — — (0.2)
Basis difference in domestic subsidiary ................................ 0.3 0.4 —
Canada capital gain exemption ...................................... — — (3.0)
Other ........................................................... 1.0 (0.4) 1.6
37.9% 37.8% 36.4%
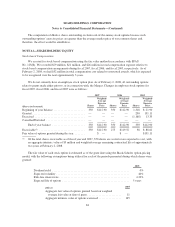
millions
February 2,
2008
February 3,
2007
Deferred tax assets and liabilities
Deferred tax assets:
Federal benefit for state and foreign taxes ................................. $ 147 $ 88
Accruals and other liabilities ........................................... 380 348
Capital leases ....................................................... 192 150
NOL carryforwards ................................................... 370 609
OPEB ............................................................. 237 258
Pension/Minimum pension ............................................. 301 355
Deferred revenue ..................................................... 218 226
Other .............................................................. 247 213
Total deferred tax assets ................................................... 2,092 2,247
Valuation allowance ...................................................... (185) (332)
Net deferred tax assets ................................................ 1,907 1,915
Deferred tax liabilities:
Tradenames/Intangibles ............................................... 1,334 1,203
Property and equipment ............................................... 170 197
Inventory ........................................................... 362 325
Investments ......................................................... 51 90
Other .............................................................. 182 98
Total deferred tax liabilities ................................................ 2,099 1,913
Net deferred tax (liability) asset ............................................. $ (192) $ 2
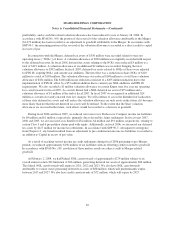
We account for income taxes in accordance with SFAS No. 109, which requires that deferred tax assets and
liabilities be recognized using enacted tax rates for the effect of temporary differences between the financial
reporting and tax bases of recorded assets and liabilities. SFAS No. 109 also requires that deferred tax assets be
reduced by a valuation allowance if it is more likely than not that some portion of or all of the deferred tax asset
will not be realized.
The Predecessor Company recorded a full valuation allowance against its pre-petition deferred tax assets in
accordance with SFAS No. 109, as realization of such assets in future years was uncertain. During fiscal 2005,
we recognized reversals of $1,249 million based on the utilization (or projected utilization) of such deferred tax
assets. As of February 2, 2008, management continues to believe that all of our pre-petition net deferred tax
assets will more likely than not be realized, due to the Merger and the actual and forecasted levels of
88