Sears 2007 Annual Report Download - page 83
Download and view the complete annual report
Please find page 83 of the 2007 Sears annual report below. You can navigate through the pages in the report by either clicking on the pages listed below, or by using the keyword search tool below to find specific information within the annual report.-
 1
1 -
2
-
3
-
4
-
5
-
6
-
7
-
8
-
9
-
10
-
11
-
12
-
13
-
14
-
15
-
16
-
17
-
18
-
19
-
20
-
21
-
22
-
23
-
24
-
25
-
26
-
27
-
28
-
29
-
30
-
31
-
32
-
33
-
34
-
35
-
36
-
37
-
38
-
39
-
40
-
41
-
42
-
43
-
44
-
45
-
46
-
47
-
48
-
49
-
50
-
51
-
52
-
53
-
54
-
55
-
56
-
57
-
58
-
59
-
60
-
61
-
62
-
63
-
64
-
65
-
66
-
67
-
68
-
69
-
70
-
71
-
72
-
 73
73 -
 74
74 -
 75
75 -
 76
76 -
 77
77 -
 78
78 -
 79
79 -
 80
80 -
 81
81 -
 82
82 -
 83
83 -
 84
84 -
 85
85 -
 86
86 -
 87
87 -
 88
88 -
 89
89 -
 90
90 -
 91
91 -
 92
92 -
 93
93 -
94
-
95
-
96
-
97
-
98
-
99
-
100
-
101
-
102
-
103
-
104
-
105
-
106
-
107
-
108
-
109
-
110
 |
 |

SEARS HOLDINGS CORPORATION
Notes to Consolidated Financial Statements—(Continued)
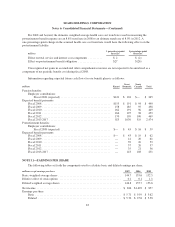
For 2008 and beyond, the domestic weighted-average health care cost trend rates used in measuring the
postretirement benefit expense are an 8.8% trend rate in 2008 to an ultimate trend rate of 8.0% in 2012. A
one-percentage-point change in the assumed health care cost trend rate would have the following effects on the
postretirement liability:
millions
1 percentage-point
Increase
1 percentage-point
Decrease
Effect on total service and interest cost components .......... $ 2 $ (2)
Effect on postretirement benefit obligation ................. $27 $(26)
Unrecognized net gains in accumulated other comprehensive income are not expected to be amortized as a
component of net periodic benefit cost during fiscal 2008.
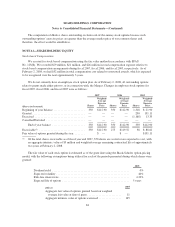
Information regarding expected future cash flows for our benefit plans is as follows:
millions Kmart
Sears
Domestic
Sears
Canada Total
Pension benefits:
Employer contributions:
Fiscal 2008 (expected) ................................... $141 $ 104 $— $ 245
Expected benefit payments:
Fiscal 2008 ................................................ $155 $ 191 $ 94 $ 440
Fiscal 2009 ................................................ 158 185 95 438
Fiscal 2010 ................................................ 162 191 96 449
Fiscal 2011 ................................................ 166 195 98 459
Fiscal 2012 ................................................ 170 199 100 469
Fiscal 2013-2017 ........................................... 925 1,030 519 2,474
Postretirement benefits:
Employer contributions:
Fiscal 2008 (expected) ................................... $— $ 43 $ 16 $ 59
Expected benefit payments:
Fiscal 2008 ................................................ $— $ 43 $ 19 $ 62
Fiscal 2009 ................................................ — 41 20 61
Fiscal 2010 ................................................ — 39 20 59
Fiscal 2011 ................................................ — 37 20 57
Fiscal 2012 ................................................ — 35 21 56
Fiscal 2013-2017 ........................................... — 143 108 251
NOTE 11—EARNINGS PER SHARE
The following tables set forth the components used to calculate basic and diluted earnings per share.
millions except earnings per share 2007 2006 2005
Basic weighted average shares ............................................ 144.7 155.6 152.5
Dilutive effect of stock options ........................................... 0.1 0.1 1.1
Diluted weighted average shares .......................................... 144.8 155.7 153.6
Net income ........................................................... $ 826 $1,492 $ 857
Earnings per share
Basic ............................................................ $ 5.71 $ 9.59 $ 5.62
Diluted .......................................................... $ 5.70 $ 9.58 $ 5.58
83