Sears 2007 Annual Report Download - page 34
Download and view the complete annual report
Please find page 34 of the 2007 Sears annual report below. You can navigate through the pages in the report by either clicking on the pages listed below, or by using the keyword search tool below to find specific information within the annual report.Fiscal 2007 Compared to Fiscal 2006
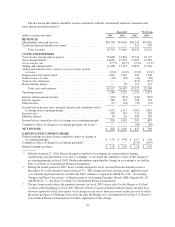
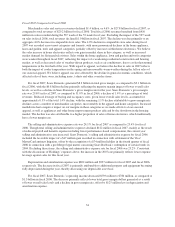
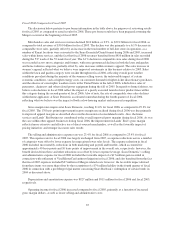
Merchandise sales and services revenues declined $1.4 billion, or 4.6%, to $27.8 billion for fiscal 2007, as
compared to total revenues of $29.2 billion for fiscal 2006. Total fiscal 2006 revenues benefited from $410
million in sales recorded during the 53rd week of the 53-week fiscal year. Excluding the impact of the 53rd week
on sales in fiscal 2006, total revenues declined $1.0 billion in fiscal 2007. The decline was due primarily to an
aggregate 4.0% decrease in comparable store sales. The 4.0% decline in comparable store sales during fiscal
2007 was recorded across most categories and formats, with more pronounced declines in the home appliance,
lawn and garden, tools and apparel categories, partially offset by increases within home electronics. We believe
the sales increase in home electronics reflects our gain in market share in this category, as well as increased
market demand for flat-panel televisions. Sales within the home appliance, lawn and garden and tools categories
were weaker throughout fiscal 2007, reflecting the impact of a weakening residential construction and housing
market, as well as decreased sales of weather-driven products, such as air conditioners, due to cooler than normal
temperatures in the first half of the year. With regard to apparel, we believe the decline in sales in 2007 reflects
both the impact of cooler temperatures in the spring and unseasonably warm weather during the fall on sales of
our seasonal apparel. We believe apparel was also affected by the decline in general economic conditions, which
affected sales of basic wear, including jeans, t-shirts and other everyday items.
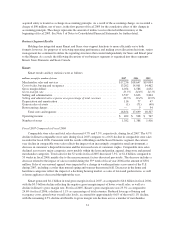
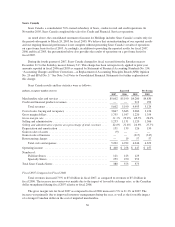
For fiscal 2007, Sears Domestic generated $8.3 billion in total gross margin, as compared to $9.1 billion in
fiscal 2006, with the $0.8 billion decline primarily reflecting the negative margin impact of lower overall sales
levels, as well as a decline in Sears Domestic’s gross margin rate for the year. Sears Domestic’s gross margin
rate was 29.6% in fiscal 2007, as compared to 31.0% in fiscal 2006, a decline of 1.4% as a percentage of total
revenues. Reduced leverage of buying and occupancy costs, given lower overall sales levels, accounted for
approximately 0.3% of the total 1.4% decline, with the remaining 1.1% decline attributable to gross margin rate
declines across a number of merchandise categories, most notably in the apparel and home categories. Increased
markdowns had a negative impact on our margins in these categories as we made efforts to clear seasonal
apparel, as well as appliances and other home improvement products affected by the slowdown in the housing
market. The decline was also attributable to a higher proportion of sales of home electronics, which traditionally
have a lower margin rate.
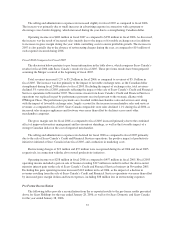
The selling and administrative expense rate was 24.1% for fiscal 2007 as compared to 23.4% for fiscal
2006. Though total selling and administrative expenses declined $122 million in fiscal 2007, mainly as the result
of reduced payroll and benefits expense including lower performance-based compensation, the current year
selling and administrative rate increased. Sears Domestic’s selling and administrative expense for fiscal 2006
included the favorable impact of a $17 million gain recorded in connection with settlement of the Visa/
MasterCard antitrust litigation, offset by the recognition of a $74 million liability in the fourth quarter of fiscal
2006 in connection with a pre-Merger legal matter concerning Sears Roebuck’s redemption of certain bonds in
2004. Excluding these items, the selling and administrative expense rate for fiscal 2006 was 23.2%. Consistent
with the discussions of Holdings’ expenses above, the increase in the 2007 rate primarily reflects lower expense
leverage against sales for this fiscal year.
Depreciation and amortization expense was $802 million and $927 million for fiscal 2007 and fiscal 2006,
respectively. The decrease in fiscal 2007 is primarily attributable to additional property and equipment becoming
fully depreciated during the year, thereby decreasing our depreciable asset base.
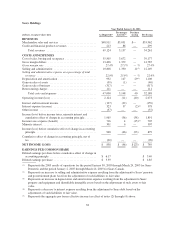
For fiscal 2007, Sears Domestic’s operating income decreased $539 million to $784 million, as compared to
$1.3 billion in fiscal 2006. The decrease primarily reflects lower total gross margin dollars generated as a result
of lower overall sales levels and a decline in gross margin rate, offset by $125 million less in depreciation and
amortization expense.
34


