Sears 2007 Annual Report Download - page 29
Download and view the complete annual report
Please find page 29 of the 2007 Sears annual report below. You can navigate through the pages in the report by either clicking on the pages listed below, or by using the keyword search tool below to find specific information within the annual report.-
 1
1 -
2
-
3
-
4
-
5
-
6
-
7
-
8
-
9
-
10
-
11
-
12
-
13
-
14
-
15
-
16
-
17
-
18
-
 19
19 -
 20
20 -
 21
21 -
 22
22 -
 23
23 -
 24
24 -
 25
25 -
 26
26 -
 27
27 -
 28
28 -
 29
29 -
 30
30 -
 31
31 -
 32
32 -
 33
33 -
 34
34 -
 35
35 -
 36
36 -
 37
37 -
 38
38 -
 39
39 -
40
-
41
-
42
-
43
-
44
-
45
-
46
-
47
-
48
-
49
-
50
-
51
-
52
-
53
-
54
-
55
-
56
-
57
-
58
-
59
-
60
-
61
-
62
-
63
-
64
-
65
-
66
-
67
-
68
-
69
-
70
-
71
-
72
-
73
-
74
-
75
-
76
-
77
-
78
-
79
-
80
-
81
-
82
-
83
-
84
-
85
-
86
-
87
-
88
-
89
-
90
-
91
-
92
-
93
-
94
-
95
-
96
-
97
-
98
-
99
-
100
-
101
-
102
-
103
-
104
-
105
-
106
-
107
-
108
-
109
-
110
 |
 |
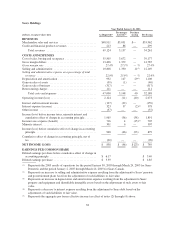
for relocation assistance and employee termination-related costs associated with Holdings’ home office
integration efforts. We did not incur any restructuring costs during fiscal 2007. See Note 6 of Notes to
Consolidated Financial Statements for further detail.
Interest and investment income was $135 million in fiscal 2007, as compared with $253 million in fiscal
2006. As discussed above, the decreased interest and investment income in fiscal 2007 was primarily due to
performance of investments in total return swaps and less interest earned on our cash balances, partially offset by
a dividend received from our investment in Sears Mexico.
We incurred $286 million in interest expense during fiscal 2007, as compared to $335 million last year. The
reduction in interest expense is attributable to lower average outstanding borrowings during fiscal 2007.
Other income is primarily comprised of bankruptcy-related recoveries in the amount of $18 million and $14
million for fiscal 2007 and 2006, respectively. Bankruptcy-related recoveries increased $4 million in fiscal 2007
and represent amounts recovered from vendors who had received cash payment for pre-petition obligations. See
Note 13 of Notes to Consolidated Financial Statements for further detail. Other income in fiscal 2006 also
included income recorded relative to foreign currency forward contracts for which hedge accounting was not
applied. See Note 8 of Notes to Consolidated Financial Statements for further details.
The effective tax rate was relatively flat at 37.9% in fiscal 2007 versus 37.8% in fiscal 2006. The decrease
in income tax expense for fiscal 2007 is primarily related to a decrease in pre-tax income during the year.
Fiscal 2006 Compared to Fiscal 2005
As discussed above, the reported consolidated statement of income for fiscal 2005 includes Sears’ results of
operations only for the period subsequent to the Merger, or from March 25, 2005 forward. We believe that
presenting fiscal 2005 results on a pro forma basis, which includes Sears’ results for the entire fiscal 2005 year, is
important to an understanding and assessment of our results, trends and on-going performance. Accordingly, we
have provided an analysis of operating results for fiscal 2006 as compared to fiscal 2005 results presented on
both a reported and a pro forma basis.
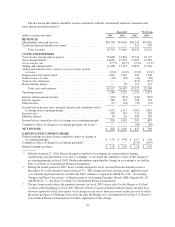
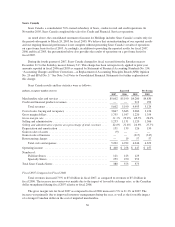
Fiscal 2006 revenues were $53.0 billion as compared to $49.5 billion (reported) and $54.3 billion (pro
forma) in fiscal 2005. The increase in fiscal 2006 revenues, as compared to reported revenues for fiscal 2005,
was primarily due to the inclusion of Sears for the entire year in fiscal 2006 and, to a lesser degree, the inclusion
of an additional week of sales in fiscal 2006. Fiscal 2006 revenues declined $1.3 billion, or 2.3%, to $53.0
billion, as compared to fiscal 2005 pro forma revenues of $54.3 billion, as a decline in comparable store sales of
3.7% in the aggregate and the impact of Kmart store closures were partially offset by the above-noted additional
week of sales recorded in fiscal 2006, and to a lesser degree, sales increases in Sears Domestic’s home services
business.
The gross margin rate was 28.7% in fiscal 2006, as compared to 27.4% (reported and pro forma) in fiscal
2005. Gross margin rates improved across all business segments: Kmart, Sears Domestic and Sears Canada, with
the increase primarily reflecting improvements realized in our apparel businesses during the year. The increase in
margins from our apparel business during 2006, and within women’s apparel at Sears Domestic in particular,
reflected the impact of having better product assortments in place relative to 2005. The improvement in
assortments lowered apparel markdowns during fiscal 2006 relative to levels in fiscal 2005. Additional
markdowns were taken in the latter half of 2005 to clear excess fashion apparel given poor customer response to
Sears Domestic full-line store apparel offerings that year.
Additionally, apparel gross margins at both Kmart and Sears Domestic benefited from fiscal 2006 efforts to
procure products at a lower cost to us including increased utilization of direct-sourced merchandise, particularly
at Sears Domestic, which had historically not utilized direct sourcing to the extent of its use at Kmart. Also, Sears
29