Sears 2007 Annual Report Download - page 54
Download and view the complete annual report
Please find page 54 of the 2007 Sears annual report below. You can navigate through the pages in the report by either clicking on the pages listed below, or by using the keyword search tool below to find specific information within the annual report.-
 1
1 -
2
-
3
-
4
-
5
-
6
-
7
-
8
-
9
-
10
-
11
-
12
-
13
-
14
-
15
-
16
-
17
-
18
-
19
-
20
-
21
-
22
-
23
-
24
-
25
-
26
-
27
-
28
-
29
-
30
-
31
-
32
-
33
-
34
-
35
-
36
-
37
-
38
-
39
-
40
-
41
-
42
-
43
-
 44
44 -
 45
45 -
 46
46 -
 47
47 -
 48
48 -
 49
49 -
 50
50 -
 51
51 -
 52
52 -
 53
53 -
 54
54 -
 55
55 -
 56
56 -
 57
57 -
 58
58 -
 59
59 -
 60
60 -
 61
61 -
 62
62 -
 63
63 -
 64
64 -
65
-
66
-
67
-
68
-
69
-
70
-
71
-
72
-
73
-
74
-
75
-
76
-
77
-
78
-
79
-
80
-
81
-
82
-
83
-
84
-
85
-
86
-
87
-
88
-
89
-
90
-
91
-
92
-
93
-
94
-
95
-
96
-
97
-
98
-
99
-
100
-
101
-
102
-
103
-
104
-
105
-
106
-
107
-
108
-
109
-
110
 |
 |

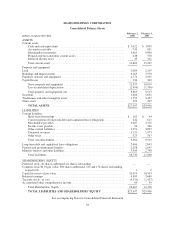
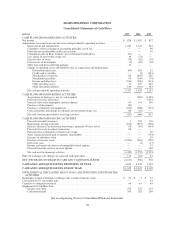
SEARS HOLDINGS CORPORATION
Consolidated Statements of Income
millions, except per share data 2007 2006 2005
REVENUES
Merchandise sales and services ........................................ $50,703 $53,016 $49,242
Credit and financial products revenues .................................. — — 213
Total revenues ................................................. 50,703 53,016 49,455
COSTS AND EXPENSES
Cost of sales, buying and occupancy .................................... 36,638 37,824 35,743
Selling and administrative ............................................ 11,468 11,574 10,892
Depreciation and amortization ......................................... 1,049 1,143 942
Gain on sales of assets ............................................... (38) (82) (39)
Gain on sale of business .............................................. — — (317)
Restructuring charges ................................................ — 28 111
Total costs and expenses ......................................... 49,117 50,487 47,332
Operating income ................................................... 1,586 2,529 2,123
Interest and investment income ........................................ (135) (253) (130)
Interest expense .................................................... 286 335 328
Other income ...................................................... (17) (24) (37)
Income before income taxes, minority interest and cumulative effect of change in
accounting principle ............................................... 1,452 2,471 1,962
Income taxes ....................................................... 550 933 715
Minority interest .................................................... 76 46 300
Income before cumulative effect of change in accounting principle ............ 826 1,492 947
Cumulative effect of change in accounting principle (net of income tax benefit of
$58) ............................................................ — — (90)
NET INCOME .................................................... $ 826 $ 1,492 $ 857
EARNINGS PER COMMON SHARE
BASIC
Earnings per share before cumulative effect of change in accounting
principle ................................................ $ 5.71 $ 9.59 $ 6.21
Cumulative effect of change in accounting principle ............... — — (0.59)
Earnings per share ...................................... $ 5.71 $ 9.59 $ 5.62
DILUTED
Diluted earnings per share before cumulative effect of change in
accounting principle ....................................... $ 5.70 $ 9.58 $ 6.17
Cumulative effect of change in accounting principle ............... — — (0.59)
Earnings per share ...................................... $ 5.70 $ 9.58 $ 5.58
Basic weighted average common shares outstanding ....................... 144.7 155.6 152.5
Diluted weighted average common shares outstanding ...................... 144.8 155.7 153.6
See accompanying Notes to Consolidated Financial Statements.
54