Sears 2007 Annual Report Download - page 40
Download and view the complete annual report
Please find page 40 of the 2007 Sears annual report below. You can navigate through the pages in the report by either clicking on the pages listed below, or by using the keyword search tool below to find specific information within the annual report.-
 1
1 -
2
-
3
-
4
-
5
-
6
-
7
-
8
-
9
-
10
-
11
-
12
-
13
-
14
-
15
-
16
-
17
-
18
-
19
-
20
-
21
-
22
-
23
-
24
-
25
-
26
-
27
-
28
-
29
-
 30
30 -
 31
31 -
 32
32 -
 33
33 -
 34
34 -
 35
35 -
 36
36 -
 37
37 -
 38
38 -
 39
39 -
 40
40 -
 41
41 -
 42
42 -
 43
43 -
 44
44 -
 45
45 -
 46
46 -
 47
47 -
 48
48 -
 49
49 -
 50
50 -
51
-
52
-
53
-
54
-
55
-
56
-
57
-
58
-
59
-
60
-
61
-
62
-
63
-
64
-
65
-
66
-
67
-
68
-
69
-
70
-
71
-
72
-
73
-
74
-
75
-
76
-
77
-
78
-
79
-
80
-
81
-
82
-
83
-
84
-
85
-
86
-
87
-
88
-
89
-
90
-
91
-
92
-
93
-
94
-
95
-
96
-
97
-
98
-
99
-
100
-
101
-
102
-
103
-
104
-
105
-
106
-
107
-
108
-
109
-
110
 |
 |

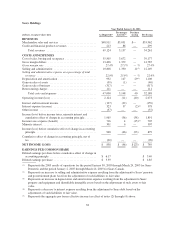
(4) On November 15, 2005, we completed the sale of substantially all assets and liabilities of Sears Canada’s
Credit and Financial Services operations. Accordingly, the credit and financial product revenues of $299
million for the pro forma fiscal year ended 2005 are not expected to re-occur.
(5) Represents the 2005 results of operations for the period from March 25, 2005 through December 31, 2005
for Sears Canada. Results of Sears Canada for the period March 25, 2005 through December 31, 2005 have
not been updated to reflect the impact of its change in year end, which occurred during the fourth quarter of
fiscal 2007.
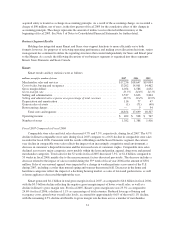
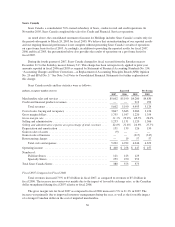
ANALYSIS OF CONSOLIDATED FINANCIAL CONDITION
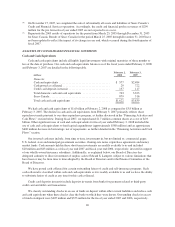
Cash and Cash Equivalents
Cash and cash equivalents include all highly liquid investments with original maturities of three months or
less at the date of purchase. Our cash and cash equivalents balances as of the fiscal years ended February 2, 2008
and February 3, 2007 are detailed in the following table.
millions
February 2,
2008
February 3,
2007
Domestic
Cash and equivalents .................................... $ 577 $2,484
Cash posted as collateral ................................. 29 722
Credit card deposits in transit ............................. 137 117
Total domestic cash and cash equivalents ................... 743 3,323
Sears Canada .......................................... 879 516
Total cash and cash equivalents ........................... $1,622 $3,839
We had cash and cash equivalents of $1.6 billion at February 2, 2008 as compared to $3.8 billion at
February 3, 2007. The decline in cash and cash equivalents from February 3, 2007 primarily reflects share
repurchases made pursuant to our share repurchase program, as further discussed in the “Financing Activities and
Cash Flows” section below. During fiscal 2007, we repurchased 21.7 million common shares at a cost of $2.9
billion. Other significant uses of cash and cash equivalents for fiscal year ended February 2, 2008 included the
use of cash and cash equivalents to fund capital expenditures (approximately $580 million) and an approximate
$600 million decrease in borrowings, net of repayments, as further detailed in the “Financing Activities and Cash
Flows” section.
Our invested cash may include, from time to time, investments in, but not limited to, commercial paper,
U.S. federal, state and municipal government securities, floating-rate notes, repurchase agreements and money
market funds. Cash amounts held in these short-term investments are readily available to us and included
$20 million and $43 million as of fiscal year end 2007 and fiscal year end 2006, respectively, invested in support
of our wholly-owned insurance subsidiary. Additionally, as explained below, our Board of Directors has
delegated authority to direct investment of surplus cash to Edward S. Lampert, subject to various limitations that
have been or may be from time to time adopted by the Board of Directors and/or the Finance Committee of the
Board of Directors.
We have posted cash collateral for certain outstanding letters of credit and self-insurance programs. Such
cash collateral is classified within cash and cash equivalents as it is readily available to us and we have the ability
to substitute letters of credit at any time for this cash collateral.
Credit card deposits in transit include deposits in-transit from banks for payments related to third-party
credit card and debit card transactions.
We classify outstanding checks in excess of funds on deposit within other current liabilities and reduce cash
and cash equivalents when these checks clear the bank on which they were drawn. Outstanding checks in excess
of funds on deposit were $405 million and $353 million for the fiscal year ended 2007 and 2006, respectively.
40