Sears 2007 Annual Report Download - page 35
Download and view the complete annual report
Please find page 35 of the 2007 Sears annual report below. You can navigate through the pages in the report by either clicking on the pages listed below, or by using the keyword search tool below to find specific information within the annual report.-
 1
1 -
2
-
3
-
4
-
5
-
6
-
7
-
8
-
9
-
10
-
11
-
12
-
13
-
14
-
15
-
16
-
17
-
18
-
19
-
20
-
21
-
22
-
23
-
24
-
 25
25 -
 26
26 -
 27
27 -
 28
28 -
 29
29 -
 30
30 -
 31
31 -
 32
32 -
 33
33 -
 34
34 -
 35
35 -
 36
36 -
 37
37 -
 38
38 -
 39
39 -
 40
40 -
 41
41 -
 42
42 -
 43
43 -
 44
44 -
 45
45 -
46
-
47
-
48
-
49
-
50
-
51
-
52
-
53
-
54
-
55
-
56
-
57
-
58
-
59
-
60
-
61
-
62
-
63
-
64
-
65
-
66
-
67
-
68
-
69
-
70
-
71
-
72
-
73
-
74
-
75
-
76
-
77
-
78
-
79
-
80
-
81
-
82
-
83
-
84
-
85
-
86
-
87
-
88
-
89
-
90
-
91
-
92
-
93
-
94
-
95
-
96
-
97
-
98
-
99
-
100
-
101
-
102
-
103
-
104
-
105
-
106
-
107
-
108
-
109
-
110
 |
 |
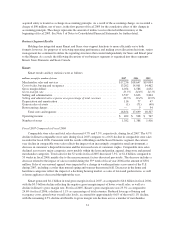
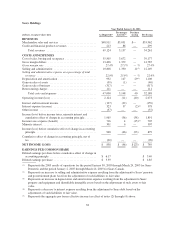
Fiscal 2006 Compared to Fiscal 2005
The discussion below pertains to pro forma information in the table above for purposes of reviewing results
for fiscal 2005 as compared to actual results for 2006. These pro forma results have been prepared assuming the
Merger occurred at the beginning of fiscal 2005.
Merchandise sales and services revenues declined $0.8 billion, or 2.9%, to $29.2 billion for fiscal 2006, as
compared to total revenues of $30.0 billion for fiscal 2005. The decline was due primarily to a 6.1% decrease in
comparable store sales, partially offset by an increase in the total number of full-line stores in operation, as a
number of Kmart locations were converted to the Sears Essentials/Grand format during 2006 and 2005, increased
sales within home services, and the fact that fiscal 2006 revenues benefited from $410 million in sales recorded
during the 53rd week of the 53-week fiscal year. The 6.1% decline in comparable store sales during fiscal 2006
was recorded across most categories and formats, with more pronounced declines in both the lawn and garden
and home fashions categories, partially offset by sales increases within women’s apparel. The sales increase in
women’s apparel reflected what we believe were improved assortments in this business relative to 2005. Sales
within the lawn and garden category were weaker throughout fiscal 2006, reflecting overall poor weather
conditions prevalent during the majority of the summer selling season, the unfavorable impact of certain
economic conditions, such as higher energy costs, on consumer demand for higher-ticket discretionary purchases,
and the absence of catastrophic weather events in the United States in the fall of 2006, which drove sales of
generators, chainsaws and other related power equipment during the fall of 2005. In regards to home fashions, we
believe sales declines in fiscal 2006 reflect the impact of a poorly executed launch of new product lines within
this category during the second quarter of fiscal 2006. Also of note, the rate of comparable store sales declines
within home appliances at Sears Domestic accelerated somewhat during the fourth quarter of fiscal 2006,
reflecting what we believe was the impact of both a slow housing market and increased competition.
Gross margin rates improved at Sears Domestic, reaching 31.0% for fiscal 2006, as compared to 29.3% for
fiscal 2005. The 170 basis point improvement in gross margin rate realized during fiscal 2006 was due primarily
to improved apparel margins as described above in the discussion of consolidated results. Also, the home
services and Lands’ End businesses contributed to the overall improved gross margins during fiscal 2006. As was
the case within other apparel businesses during fiscal 2006, the improvement in Lands’ End’s gross margin
reflected more extensive and effective use of direct-sourced merchandise, as well as the favorable impact of
pricing initiatives and stronger in-season sales results.
The selling and administrative expense rate was 23.4% for fiscal 2006 as compared to 23.4% for fiscal
2005. The expense rate for fiscal 2006 was largely unchanged from 2005, as expense reductions across a number
of categories were offset by lower expense leverage given lower sales levels. The expense reduction in fiscal
2006 included, most notably, reductions in both marketing and payroll and benefits, which accounted for
approximately 40 basis points and 10 basis points of improvement in the overall rate, respectively; however, the
benefit derived from these and other reductions was offset by lower expense leverage. Sears Domestic’s selling
and administrative expense for fiscal 2006 included the favorable impact of a $17 million gain recorded in
connection with settlement of Visa/MasterCard antitrust litigation in fiscal 2006, and also benefited from the fact
that fiscal 2005 expenses included $37 million of Merger-related costs; however, the favorable impact derived
from these items was more than offset by the recognition of a $74 million liability in the fourth quarter of fiscal
2006 in connection with a pre-Merger legal matter concerning Sears Roebuck’s redemption of certain bonds in
2004 as discussed above.
Depreciation and amortization expense was $927 million and $911 million for fiscal 2006 and fiscal 2005,
respectively.
Operating income for fiscal 2006 increased compared to fiscal 2005, primarily as a function of increased
gross margin dollars, as well as lower selling and administrative costs.
35